Spring 2021 projects
Templates
Our course project template can be found here, or on Scholar:
/class/datamine/apps/templates/project_template.Rmd
Important note: We've updated the template to allow a code chunk option that prevents content from running off the page. Simply add linewidth=80 to any code chunk that creates output that runs off the page.
This video demonstrates:
- opening a browser (emphasizing Firefox as the best choice),
- opening RStudio Server Pro (https://rstudio.scholar.rcac.purdue.edu),
- introducing (basics) about what RStudio looks like,
- checking to see that the students are using R 4.0,
- running the initial (one-time) setup script,
- opening the project template,
- knitting the template into a PDF file, and
- finally handling the popup blocker, which can potentially block the PDF.
Students in STAT 19000, 29000, and 39000 are to use this as a template for all project submissions. The template includes a code chunk that "activates" our Python environment, and adjusts some default settings. In addition, it provides examples on how to include solutions for Python, R, Bash, and SQL. Every question should be clearly marked with a third-level header (using 3 #s) followed by Question 1, Question 2, etc. Sections for solutions should be added or removed, based on the number of questions in the given project. All code chunks are to be run and solutions displayed for the compiled PDF submission.
Any format or template related questions should be asked in Piazza.
Submissions
Unless otherwise specified, all projects will need 2-4 submitted files:
- A compiled PDF file (built using the template), with all code and output.
- The .Rmd file (based off of the template), used to Knit the final PDF.
- If it is a project containing R code, a .R file containing all of the R code with comments explaining what the code does. Note: This is not an .Rmd file.
- If it is a project containing Python code, a .py file containing all of the Python code.
See here to learn how to transfer files to and from Scholar.
STAT 19000
Topics
The following table roughly highlights the topics and projects for the semester. This is slightly adjusted throughout the semester as student performance and feedback is taken into consideration.
| Language | Project # | Name | Topics |
|---|---|---|---|
| Python | 1 | Intro to Python: part I | declaring variables, printing, running cells, exporting to different formats, etc. |
| Python | 2 | Intro to Python: part II | lists, tuples, if statements, opening files, pandas, matplotlib, etc. |
| Python | 3 | Intro to Python: part III | sets, dicts, pandas, matplotlib, lists, tuples, etc. |
| Python | 4 | Control flow in Python | if statements, for loops, dicts, lists, matplotlib, etc. |
| Python | 5 | Scientific computing/Data wrangling: part I | timing, I/O, indexing in pandas, pandas functions, matplotlib, etc. |
| Python | 6 | Functions: part I | writing functions, docstrings, pandas, etc. |
| Python | 7 | Functions: part II | writing functions, docstrings, pandas, etc. |
| Python | 8 | Scientific computing/Data wrangling: part II | building a recommendation system |
| Python | 9 | Scientific computing/Data wrangling: part III | building a recommendation system, continued... |
| Python | 10 | Packages | Learn more about Python packaging, importing, etc. |
| Python | 11 | Python Classes: part I | writing classes in Python to build a game, dunder methods, attributes, methods, etc. |
| Python | 12 | Python Classes: part II | writing classes in Python to build a game, dunder methods, attributes, methods, etc., continued... |
| Python | 13 | Data wrangling & matplotlib: part I | more pandas, more matplotlib, wrangling with increased difficulty, etc. |
| Python | 14 | Data wrangling & matplotlib: part II | more pandas, more matplotlib, wrangling with increased difficulty, etc. |
Project 1
Motivation: In this course we require the majority of project submissions to include a compiled PDF, a .Rmd file based off of our template, and a code file (a .R file if the project is in R, a .py file if the project is in Python). Although RStudio makes it easy to work with both Python and R, there are occasions where working out a Python problem in a Jupyter Notebook could be convenient. For that reason, we will introduce Jupyter Notebook in this project.
Context: This is the first in a series of projects that will introduce Python and its tooling to students.
Scope: jupyter notebooks, rstudio, python
Learning objectives:
- Use Jupyter Notebook to run Python code and create Markdown text.
- Use RStudio to run Python code and compile your final PDF.
- Gain exposure to Python control flow and reading external data.
Make sure to read about, and use the template found here, and the important information about projects submissions here.
Dataset
The following questions will use the dataset found in Scholar:
/class/datamine/data/open_food_facts/openfoodfacts.tsv
Questions
Solution
- .ipynb
- .py
- .html
- .md
- .rst
- .tex
2. Each "box" in a Jupyter Notebook is called a cell. There are two primary types of cells: code, and markdown. By default, a cell will be a code cell. Place the following Python code inside the first cell, and run the cell. What is the output?
from thedatamine import hello_datamine
hello_datamine()
Hint: You can run the code in the currently selected cell by using the GUI (the buttons), as well as by pressing Ctrl+Return/Enter.
Item(s) to submit:
- Output from running the provided code.
Solution
"Hello student! Welcome to The Data Mine!"
3. Jupyter Notebooks allow you to easily pull up documentation, similar to ?function in R. To do so, use the help function, like this: help(my_function). What is the output from running the help function on hello_datamine? Can you modify the code from question (2) to print a customized message? Create a new markdown cell and explain what you did to the code from question (2) to make the message customized.
Important note: Some Jupyter-only methods to do this are:
- Click on the function of interest and type
Shift+TaborShift+Tab+Tab. - Run
function?, for example,print?.
Important note: You can also see the source code of a function in a Jupyter Notebook by typing function??, for example, print??.
Item(s) to submit:
-
Output from running the
helpfunction onhello_datamine. - Modified code from question (2) that prints a customized message.
Solution
help(hello_datamine)Help on function hello_datamine in module thedatamine.core:
hello_datamine(name: str = 'student') -> None Prints a hello message to a Data Mine student.
Args:
str (name, optional): The name of a student. Defaults to 'student'.hello_datamine("Kevin")4. At this point in time, you've now got the basics of running Python code in Jupyter Notebooks. There is really not a whole lot more to it. For this class, however, we will continue to create RMarkdown documents in addition to the compiled PDFs. You are welcome to use Jupyter Notebooks for personal projects or for testing things out, however, we will still require an RMarkdown file (.Rmd), PDF (generated from the RMarkdown file), and .py file (containing your python code). For example, please move your solutions from Questions 1, 2, 3 from Jupyter Notebooks over to RMarkdown (we discuss RMarkdown below). Let's learn how to run Python code chunks in RMarkdown.
Sign in to https://rstudio.scholar.rcac.purdue.edu (with BoilerKey). Projects in The Data Mine should all be submitted using our template found here or on Scholar (/class/datamine/apps/templates/project_template.Rmd).
Open the project template and save it into your home directory, in a new RMarkdown file named project01.Rmd. Prior to running any Python code, run datamine_py() in the R console, just like you did at the beginning of every project from the first semester.
Code chunks are parts of the RMarkdown file that contains code. You can identify what type of code a code chunk contains by looking at the engine in the curly braces "{" and "}". As you can see, it is possible to mix and match different languages just by changing the engine. Move the solutions for questions 1-3 to your project01.Rmd. Make sure to place all Python code in python code chunks. Run the python code chunks to ensure you get the same results as you got when running the Python code in a Jupyter Notebook.
Important note: Make sure to run datamine_py() in the R console prior to attempting to run any Python code.
Hint: The end result of the project01.Rmd should look similar to this.
Item(s) to submit:
-
project01.Rmdwith the solutions from questions 1-3 (including any Python code inpythoncode chunks).
Solution
Done.
5. It is not a Data Mine project without data! Here are some examples of reading in data line by line using the csv package. How many columns are in the following dataset: /class/datamine/data/open_food_facts/openfoodfacts.tsv? Print the first row, the number of columns, and then exit the loop after the first iteration using the break keyword.
Hint: You can get the number of elements in a list by using the len method. For example: len(my_list).
Hint: You can use the break keyword to exit a loop. As soon as break is executed, the loop is exited and the code immediately following the loop is run.
for my_row in my_csv_reader:
    print(my_row)
    break

print("Exited loop as soon as 'break' was run.")
Hint: '\t' represents a tab in Python.
Important note: If you get a Dtype warning, feel free to just ignore it.
Relevant topics: for loops, break, print
Item(s) to submit:
- Python code used to solve this problem.
- The first row printed, and the number of columns printed.
Solution
import csv
with open('/class/datamine/data/open_food_facts/openfoodfacts.tsv') as my_file:
    my_reader = csv.reader(my_file, delimiter='\t')
    for row in my_reader:
        print(row)
        print(len(row))
        break # prematurely leave the loop
6 (optional). Unlike in R, where many of the tools you need are built-in (read.csv, data.frames, etc.), in Python, you will need to rely on packages like numpy and pandas to do the bulk of your data science work.
In R it would be really easy to find the mean of the 151st column, caffeine_100g:
myDF <- read.csv("/class/datamine/data/open_food_facts/openfoodfacts.tsv", sep="\t", quote="")
mean(myDF$caffeine_100g, na.rm=T) # 2.075503
If you were to try to modify our loop from question (5) to do the same thing, you will run into a myriad of issues, just to try and get the mean of a column. Luckily, it is easy to do using pandas:
import pandas as pd
myDF = pd.read_csv("/class/datamine/data/open_food_facts/openfoodfacts.tsv", sep="\t")
myDF["caffeine_100g"].mean() # 2.0755028571428573
Take a look at some of the methods you can perform using pandas here. Perform an interesting calculation in R, and replicate your work using pandas. Which did you prefer, Python or R?
Item(s) to submit:
- R code used to solve the problem.
- Python code used to solve the problem.
Solution
# could be anything.Project 2
Motivation: In Python it is very important to understand some of the data types in a little bit more depth than you would in R. Many of the data types in Python will seem very familiar. A character in R is similar to a str in Python. An integer in R is an int in Python. A numeric in R is similar to a float in Python. A logical in R is similar to a bool in Python. In addition to all of that, there are some very popular classes that packages like numpy and pandas introduces. On the other hand, there are some data types in Python like tuples, lists, sets, and dicts that diverge from R a little bit more. It is integral to understand some basic concepts before jumping too far into everything.
Context: This is the second project introducing some basic data types, and demonstrating some familiar control flow concepts, all while digging right into a dataset.
Scope: tuples, lists, if statements, opening files
Learning objectives:
- List the differences between lists & tuples and when to use each.
- Gain familiarity with string methods, list methods, and tuple methods.
- Demonstrate the ability to read and write data of various formats using various packages.
Make sure to read about, and use the template found here, and the important information about projects submissions here.
Dataset
The following questions will use the dataset found in Scholar:
/class/datamine/data/craigslist/vehicles.csv
Questions
1. Read in the dataset /class/datamine/data/craigslist/vehicles.csv into a pandas DataFrame called myDF. pandas is an integral tool for various data science tasks in Python. You can read a quick intro here. We will be slowly introducing bits and pieces of this package throughout the semester. Similarly, we will try to introduce byte-sized (ha!) portions of plotting packages to slowly build up your skills.
How big is the dataset (in Mb or Gb)?
Important note: If you didn't do optional question 6 in project 1, we would recommend taking a look.
Hint: Remember to check out a question's relevant topics. We try very hard to link you to content and examples that will get you up and running as quickly as possible.
Relevant topics: pandas read_csv, get filesize in Python
Item(s) to submit:
- Python code used to solve the problem.
Solution
import pandas as pd
from pathlib import Path

myDF = pd.read_csv("/class/datamine/data/craigslist/vehicles.csv")

p = Path("/class/datamine/data/craigslist/vehicles.csv")
size_in_mb = p.stat().st_size/1000
print(size_in_mb)
2. In question (1) we read in our data into a pandas DataFrame. Use one of the pandas DataFrame attributes to get the number of columns and rows of our dataset. How many columns and rows are there? Use f-strings to print a message, for example:
There are 123 columns in the DataFrame!
There are 321 rows in the DataFrame!
In project 1, we learned how to read a csv file in, line-by-line, and print values. Use the csv package to print just the first row, which should contain the names of the columns, OR instead of using the csv package, use one of the pandas attributes from myDF (to print the column names).
Relevant topics: csv read csv, pandas DataFrame, f-strings, break
Item(s) to submit:
- The output from printing the f-strings.
- Python code used to solve the problem.
Solution
print(f'There are {myDF.shape[1]} columns in the DataFrame!')
print(f'There are {myDF.shape[0]} columns in the DataFrame!')
import csv
our_row = []
with open("/class/datamine/data/craigslist/vehicles.csv") as my_file:
my_reader = csv.reader(my_file)
for row in my_reader:
our_row = row
break
print(our_row)
print(myDF.columns.to_list())3. Use the csv or pandas package to get a list called our_columns that contains the column names. Add a string, "extra", to the end of our_columns. Print the second value in the list. Without using a loop, print the 1st, 3rd, 5th, etc. elements of the list. Print the last four elements of the list ( "state", "lat", "long", and "extra") by accessing their negative index.
"extra" doesn't belong in our list, you can easily remove this value from our list by doing the following:
our_columns.pop(25)

# or even this, as pop removes the last value by default
our_columns.pop()
BUT the problem with this solution is that you must know the index of the value you'd like to remove, and sometimes you do not know the index of the value. Instead, please show how to use a list method to remove "extra" by value rather than by index.
Relevant topics: csv read csv, break, append, indexing
Item(s) to submit:
- Python code used to solve the problem.
- The output from running your code.
Solution
our_columns = []
with open("/class/datamine/data/craigslist/vehicles.csv") as my_file:
    my_reader = csv.reader(my_file)
    for row in my_reader:
        our_columns = row
        break

our_columns.append("extra")
print(our_columns[1])
print(our_columns[::2])
print(our_columns[-4:])

print(our_columns.remove("extra"))
4. matplotlib is one of the primary plotting packages in Python. You are provided with the following code:
my_values = tuple(myDF.loc[:, 'odometer'].dropna().to_list())The result is a tuple containing the odometer readings from all of the vehicles in our dataset. Create a lineplot of the odometer readings.
Well, that plot doesn't seem too informative. Let's first sort the values in our tuple:
my_values.sort()What happened? A tuple is immutable. What this means is that once the contents of a tuple are declared they cannot be modified. For example:
# This will fail because tuples are immutable
my_values[0] = 100
You can read a good article about this here. In addition, here is a great post that gives you an idea when using a tuple might be a good idea. Okay, so let's go back to our problem. We know that lists are mutable (and therefore sortable), so convert my_values to a list and then sort, and re-plot.
It looks like there are some (potential) outliers that are making our plot look a little wonky. For the sake of seeing how the plot would look, use negative indexing to plot the sorted values minus the last 50 values (the 50 highest values). New new plot may not look that different, that is okay.
Hint: To prevent plotting values on the same plot, close your plot with the close method, for example:
import matplotlib.pyplot as plt
my_values = [1,2,3,4,5]
plt.plot(my_values)
plt.show()
plt.close()
Relevant topics: list methods, indexing, matplotlib lineplot
Item(s) to submit:
- Python code used to solve the problem.
- The output from running your code.
Solution
import matplotlib.pyplot as plt

my_values = tuple(myDF.loc[:, 'odometer'].dropna().to_list())
plt.plot(my_values)
plt.close()

my_values = list(my_values)
my_values.sort()
plt.plot(my_values)
plt.show()
plt.close()

plt.plot(my_values[:-50])
plt.show()
plt.close()
5. We've covered a lot in this project! Use what you've learned so far to do one (or more) of the following tasks:
- Create a cool graphic using matplotlib, that summarizes some data from our dataset.
- Use pandas and your investigative skills to sift through the dataset and glean an interesting factoid.
- Create some commented coding examples that highlight the differences between lists and tuples. Include at least 3 examples.
Relevant topics: pandas, indexing, matplotlib
Item(s) to submit:
- Python code used to solve the problem.
- The output from running your code.
Solution
# Could be anything.Project 3
Motivation: A dictionary (referred to as a dict) is one of the most useful data structures in Python. You can think about them as a data structure containing key: value pairs. Under the hood, a dict is essentially a data structure called a hash table. Hash tables are a data structure with a useful set of properties. The time needed for searching, inserting, or removing a piece of data has a constant average lookup time, meaning that no matter how big your hash table grows to be, inserting, searching, or deleting a piece of data will usually take about the same amount of time. (The worst case time increases linearly.) Dictionaries (dict) are used a lot, so it is worthwhile to understand them. Although not used quite as often, another important data type called a set, is also worthwhile learning about.
Dictionaries, often referred to as dicts, are really powerful. There are two primary ways to "get" information from a dict. One is to use the get method, the other is to use square brackets and strings. Test out the following to understand the differences between the two:
my_dict = {"fruits": ["apple", "orange", "pear"], "person": "John", "vegetables": ["carrots", "peas"]}

# If "person" is indeed a key, they will function the same way
my_dict["person"]
my_dict.get("person")

# If the key does not exist, like below, they will not
# function the same way.
my_dict.get("height") # Returns None when key doesn't exist
print(my_dict.get("height")) # By printing, we can see None in this case
my_dict["height"] # Throws a KeyError exception because the key, "height" doesn't exist
Context: In our third project, we introduce some basic data types, and we demonstrate some familiar control flow concepts, all while digging right into a dataset. Throughout the course, we will slowly introduce concepts from pandas, and popular plotting packages.
Scope: dicts, sets, if/else statements, opening files, tuples, lists
Learning objectives:
-
Explain what is a
dictis and why it is useful. -
Understand how a
setworks and when it could be useful. - List the differences between lists & tuples and when to use each.
- Gain familiarity with string methods, list methods, and tuple methods.
- Gain familiarity with dict methods.
Make sure to read about, and use the template found here, and the important information about projects submissions here.
Dataset
The following questions will use the dataset found in Scholar:
/class/datamine/data/craigslist/vehicles.csv
Questions
1. In project 2 we learned how to read in data using pandas. Read in the (/class/datamine/data/craigslist/vehicles.csv) dataset into a DataFrame called myDF using pandas. In R we can get a sneak peek at the data by doing something like:
head(myDF) # where myDF is a data.frameThere is a very similar (and aptly named method) in pandas that allows us to do the exact same thing with a pandas DataFrame. Get the head of myDF, and take a moment to consider how much time it would take to get this information if we didn't have this nice head method.
Relevant topics: pandas read_csv, head
Item(s) to submit:
- Python code used to solve the problem.
-
The
headof the dataset.
Solution
import pandas as pd

myDF = pd.read_csv("/class/datamine/data/craigslist/vehicles.csv")
myDF.head()
2. Dictionaries, often referred to as dicts, are really powerful. There are two primary ways to "get" information from a dict. One is to use the get method, the other is to use square brackets and strings. Test out the following to understand the differences between the two:
my_dict = {"fruits": ["apple", "orange", "pear"], "person": "John", "vegetables": ["carrots", "peas"]}

# If "person" is indeed a key, they will function the same way
my_dict["person"]
my_dict.get("person")

# If the key does not exist, like below, they will not
# function the same way.
my_dict.get("height") # Returns None when key doesn't exist
print(my_dict.get("height")) # By printing, we can see None in this case
my_dict["height"] # Throws a KeyError exception because the key, "height" doesn't exist
Look at the dataset. Create a dict called my_dict that contains key:value pairs where the keys are years, and the values are a single int representing the number of vehicles from that year on craigslist. Use the year column, a loop, and a dict to accomplish this. Print the dictionary. You can use the following code to extract the year column as a list. In the next project we will learn how to loop over pandas DataFrames.
Hint: If you get a KeyError, remember, you must declare each key value pair just like any other variable. Use the following code to initialize each year key to the value 0.
myyears = myDF['year'].dropna().to_list()

# get a list containing each unique year
unique_years = list(set(myyears))

# for each year (key), initialize the value (value) to 0
my_dict = {}
for year in unique_years:
    my_dict[year] = 0
Hint: Here are some of the results you should get:
print(my_dict[1912]) # 5
print(my_dict[1982]) # 185
print(my_dict[2014]) # 31703
Note: There is a special kind of dict called a defaultdict, that allows you to give default values to a dict, giving you the ability to "skip" initialization. We will show you this when we release the solutions to this project! It is not required, but it is interesting to know about!
Relevant topics: dicts
Item(s) to submit:
- Python code used to solve the problem.
-
my_dictprinted.
Solution
years = myDF['year'].dropna().to_list()

unique_years = list(set(years))

my_dict = {}
for year in unique_years:
    my_dict[year] = 0

for year in years:
    my_dict[year] += 1

print(my_dict)
OR
from collections import defaultdict

years = myDF['year'].dropna().to_list()
my_dict = defaultdict(int)
for year in years:
    my_dict[year] += 1

print(my_dict)
3. After completing question (2) you can easily access the number of vehicles from a given year. For example, to get the number of vehicles on craigslist from 1912, just run:
my_dict[1912]

# or

my_dict.get(1912)
A dict stores its data in key:value pairs. Identify a "key" from my_dict, as well as the associated "value". As you can imagine, having data in this format can be very beneficial. One benefit is the ability to easily create a graphic using matplotlib. Use matplotlib to create a bar graph with the year on the x-axis, and the number of vehicles from that year on the y-axis.
Important note: If when you end up seeing something like <BarContainer object of X artists>, you should probably end the code chunk with plt.show() instead. What is happening is Python is trying to print the plot object. That text is the result. To instead display the plot you need to call plt.show().
Hint: To use matplotlib, first import it:
import matplotlib.pyplot as plt

# now you can use it, for example
plt.plot([1,2,3,1])
plt.show()
plt.close()
Hint: The keys method and values method from dict could be useful here.
Relevant topics: dicts, matplotlib, barplot
Item(s) to submit:
- Python code used to solve the problem.
- The resulting plot.
-
A sentence giving an example of a "key" and associated "value" from
my_dict(e.g., a sentence explaining the 1912 example above).
Solution
In my_dict a key is 1912, and the associated value is 5.
import matplotlib.pyplot as plt

plt.bar(my_dict.keys(), my_dict.values())
4. In the hint in question (2), we used a set to quickly get a list of unique years in a list. Some other common uses of a set are when you want to get a list of values that are in one list but not another, or get a list of values that are present in both lists. Examine the following code. You'll notice that we are looping over many values. Replace the code for each of the three examples below with code that uses no loops whatsoever.
listA = [1, 2, 3, 4, 5, 6, 12, 12]
listB = [2, 1, 7, 7, 7, 2, 8, 9, 10, 11, 12, 13]

# 1. values in list A but not list B
# values in list A but not list B
onlyA = []
for valA in listA:
    if valA not in listB and valA not in onlyA:
        onlyA.append(valA)

print(onlyA) # [3, 4, 5, 6]

# 2. values in listB but not list A
onlyB = []
for valB in listB:
    if valB not in listA and valB not in onlyB:
        onlyB.append(valB)

print(onlyB) # [7, 8, 9, 10, 11, 13]

# 3. values in both lists
# values in both lists
in_both_lists = []
for valA in listA:
    if valA in listB and valA not in in_both_lists:
        in_both_lists.append(valA)

print(in_both_lists) # [1,2,12]
Hint: You should use a set.
Note: In addition to being easier to read, using a set is much faster than loops!
Note: A set is a group of values that are unordered, unchangeable, and no duplicate values are allowed. While they aren't used a lot, they can be useful for a few common tasks like: removing duplicate values efficiently, efficiently finding values in one group of values that are not in another group of values, etc.
Relevant topics: sets
Item(s) to submit:
- Python code used to solve the problem.
- The output from running the code.
Solution
listA = [1, 2, 3, 4, 5, 6, 12, 12]
listB = [2, 1, 7, 7, 7, 2, 8, 9, 10, 11, 12, 13]

onlyA = list(set(listA) - set(listB))
print(onlyA)

onlyB = list(set(listB) - set(listA))
print(onlyB)

in_both_lists = list(set.intersection(set(listA), set(listB)))
print(in_both_lists)
5. The value of a dictionary does not have to be a single value (like we've shown so far). It can be anything. Observe that there is latitude and longitude data for each row in our DataFrame (lat and long, respectively). Wouldn't it be useful to be able to quickly "get" pairs of latitude and longitude data for a given state?
First, run the following code to get a list of tuples where the first value is the state, the second value is the lat, and the third value is the long.
states_list = list(myDF.loc[:, ["state", "lat", "long"]].dropna().to_records(index=False))
states_list[0:3] # [('az', 34.4554, -114.269), ('or', 46.1837, -123.824), ('sc', 34.9352, -81.9654)]

# to get the first tuple
states_list[0] # ('az', 34.4554, -114.269)

# to get the first value in the first tuple
states_list[0][0] # az

# to get the second tuple
states_list[1] # ('or', 46.1837, -123.824)

# to get the first value in the second tuple
states_list[1][0] # or
Hint: If you have an issue where you cannot append values to a specific key, make sure to first initialize the specific key to an empty list so the append method is available to use.
Now, organize the latitude and longitude data in a dictionary called geoDict such that each state from the state column is a key, and the respective value is a list of tuples, where the first value in each tuple is the latitude (lat) and the second value is the longitude (long). For example, the first 2 (lat,long) pairs in Indiana ("in") are:
geoDict.get("in")[0:2] # [(39.0295, -86.8675), (38.8585, -86.4806)]
len(geoDict.get("in")) # 5687Now that you can easily access latitude and longitude pairs for a given state, run the following code to plot the points for Texas (the state value is "tx"). Include the the graphic produced below in your solution, but feel free to experiment with other states.
NOTE: You do NOT need to include this portion of Question 5 in your Markdown .Rmd file. We cannot get this portion to build in Markdown, but please do include it in your Python .py file.
from shapely.geometry import Point
import geopandas as gpd
from geopandas import GeoDataFrame

usa = gpd.read_file('/class/datamine/data/craigslist/cb_2018_us_state_20m.shp')
usa.crs = {'init': 'epsg:4269'}

pts = [Point(y,x) for x, y in geoDict.get("tx")]
gdf = gpd.GeoDataFrame(geometry=pts, crs = 4269)
fig, gax = plt.subplots(1, figsize=(10,10))
base = usa[usa['NAME'].isin(['Hawaii', 'Alaska', 'Puerto Rico']) == False].plot(ax=gax, color='white', edgecolor='black')
gdf.plot(ax=base, color='darkred', marker="*", markersize=10)
plt.show()
plt.close()

# to save to jpg:
plt.savefig('q5.jpg')
Relevant topics: dicts, lists and tuples
Item(s) to submit:
- Python code used to solve the problem.
-
Graphic file (
q5.jpg) produced for the given state.
Solution
geoDict = dict()

for val in states_list:
    geoDict[val[0]] = []

for val in states_list:
    geoDict[val[0]].append((val[1],val[2]))

geoDict.get("in")[0:2]
len(geoDict.get("in"))
from shapely.geometry import Point
import geopandas as gpd
from geopandas import GeoDataFrame
usa = gpd.read_file('/class/datamine/data/craigslist/cb_2018_us_state_20m.shp')
usa.crs = {'init': 'epsg:4269'}
pts = [Point(y,x) for x, y in geoDict.get("tx")]
gdf = gpd.GeoDataFrame(geometry=pts, crs = 4269)
fig, gax = plt.subplots(1, figsize=(10,10))
base = usa[usa['NAME'].isin(['Hawaii', 'Alaska', 'Puerto Rico']) == False].plot(ax=gax, color='white', edgecolor='black')
gdf.plot(ax=base, color='darkred', marker="*", markersize=10)
plt.show()
# to save to jpg:
plt.savefig('q5.jpg')6. Use your new skills to extract some sort of information from our dataset and create a graphic. This can be as simple or complicated as you are comfortable with!
Relevant topics: dicts, lists and tuples
Item(s) to submit:
- Python code used to solve the problem.
- The graphic produced using the code.
Solution
Could be anything.
Project 4
Motivation: We've now been introduced to a variety of core Python data structures. Along the way we've touched on a bit of pandas, matplotlib, and have utilized some control flow features like for loops and if statements. We will continue to touch on pandas and matplotlib, but we will take a deeper dive in this project and learn more about control flow, all while digging into the data!
Context: We just finished a project where we were able to see the power of dictionaries and sets. In this project we will take a step back and make sure we are able to really grasp control flow (if/else statements, loops, etc.) in Python.
Scope: python, dicts, lists, if/else statements, for loops
Learning objectives:
- List the differences between lists & tuples and when to use each.
- Explain what is a dict and why it is useful.
- Demonstrate a working knowledge of control flow in python: if/else statements, while loops, for loops, etc.
Make sure to read about, and use the template found here, and the important information about projects submissions here.
Dataset
The following questions will use the dataset found in Scholar:
/class/datamine/data/craigslist/vehicles.csv
Questions
1. Unlike in R, where traditional loops are rare and typically accomplished via one of the apply functions, in Python, loops are extremely common and important to understand. In Python, any iterator can be looped over. Some common iterators are: tuples, lists, dicts, sets, pandas Series, and pandas DataFrames. In the previous project we had some examples of looping over lists, let's learn how to loop over pandas Series and Dataframes!
Load up our dataset /class/datamine/data/craigslist/vehicles.csv into a DataFrame called myDF. In project (3), we organized the latitude and longitude data in a dictionary called geoDict such that each state from the state column is a key, and the respective value is a list of tuples, where the first value in each tuple is the latitude (lat) and the second value is the longitude (long). Repeat this question, but do not use lists, instead use pandas to accomplish this.
Hint: The data frame has 435,849 rows, and it takes forever to accomplish this with pandas. We just want you to do this one time, to see how slow this is. Try it first with only 10 rows, and then with 100 rows, and once you are sure it is working, try it with (say) 20,000 rows. You do not need to do this with the entire data frame. It takes too long!
Relevant topics: DataFrame.iterrows(),
Item(s) to submit:
- Python code used to solve the problem.
- Output from running your code.
Solution
import pandas as pd

myDF = pd.read_csv("/class/datamine/data/craigslist/vehicles.csv")

geoDict = dict()
for my_index, my_row in myDF.iterrows():
    geoDict[my_row["state"]] = []

for my_index, my_row in myDF.iterrows():
    geoDict[my_row["state"]].append((my_row["lat"], my_row["long"]))

geoDict.get("in")[0:2]
len(geoDict.get("in"))
2. Wow! The solution to question (1) was slow. In general, you'll want to avoid looping over large DataFrames. Here is a pretty good explanation of why, as well as a good system on what to try when computing something. In this case, we could have used indexing to get latitude and longitude values for each state, and would have no need to build this dict.
The method we learned in Project 3, Question 5 is faster and easier! Just in case you did not solve Project 3, Question 5, here is a fast way to build geoDict:
import pandas as pd
myDF = pd.read_csv("/class/datamine/data/craigslist/vehicles.csv")
states_list = list(myDF.loc[:, ["state", "lat", "long"]].dropna().to_records(index=False))
geoDict = {}
for mytriple in states_list:
  geoDict[mytriple[0]] = []
for mytriple in states_list:
  geoDict[mytriple[0]].append( (mytriple[1],mytriple[2]) )
Now we will practice iterating over a dictionary, list, and tuple, all at once! Loop through geoDict and use f-strings to print the state abbreviation. Print the first latitude and longitude pair, as well as every 5000th latitude and longitude pair for each state. Round values to the hundreths place. For example, if the state was "pu", and it had 12000 latitude and longitude pairs, we would print the following:
pu:
Lat: 41.41, Long: 41.41
Lat: 22.21, Long: 21.21
Lat: 11.11, Long: 10.22
In the above example, Lat: 41.41, Long: 41.41 would be the 0th pair, Lat: 22.21, Long: 21.21 would be the 5000th pair, and Lat: 11.11, Long: 10.22 would be the 10000th pair. Make sure to use f-strings to round the latitude and longitude values to two decimal places.
There are several ways to solve this question. You can use whatever method is easiest for you, but please be sure (as always) to add comments to explain your method of solution.
Hint: Enumerate is a useful function that adds an index to our loop.
Hint: Using an if statement and the modulo operator could be useful.
Note: Whenever we have a loop within another loop, the "inner" loop is called a "nested" loop, as it is "nested" inside of the other.
Relevant topics: dicts, modulus operator, f-strings, if/else, for loops
Item(s) to submit:
- Python code used to solve the problem.
- Output from running your code.
Solution
for key, value in geoDict.items():
    print(f'{key}:')
    for idx, triplet in enumerate(value):
        if (idx % 5000 == 0):
            print(f'Lat: {triplet[0]:.2f}, Long: {triplet[1]:.2f}')
3. We are curious about how the year of the car (year) effects the price (price). In R, we could get the median price by year easily, using tapply:
tapply(myDF$price, myDF$year, median, na.rm=T)Using pandas, we would do this:
res = myDF.groupby(['year'], dropna=True).median()These are very convenient functions that do a lot of work for you. If we were to take a look at the median price of cars by year, it would look like:
import matplotlib.pyplot as plt

res = myDF.groupby(['year'], dropna=True).median()["price"]
plt.bar(res.index, res.values)
Using the content of the variable my_list provided in the code below, calculate the median car price per year without using the median function and without using a sort function. Use only dictionaries, for loops and if statements. Replicate the plot generated by running the code above (you can use the plot to make sure it looks right).
my_list = list(myDF.loc[:, ["year", "price",]].dropna().to_records(index=False))Hint: If you do not want to write your own median function to find the median, then it is OK to just use the getMid function found here or to use a median function from elsewhere on the web. Just be sure to cite your source, if you do use a median function that someone else provides or that you use from the internet. There are many small variations on median functions, especially when it comes to (for instance) lists with even length.
Hint: It is also OK to use: import statistics and the function statistics.median
Relevant topics: dicts, for loops, if/else
Item(s) to submit:
- Python code used to solve the problem.
- Output from running your code.
- The barplot.
Solution
from collections import defaultdict
import matplotlib.pyplot as plt

my_list = list(myDF.loc[:, ["year", "price",]].dropna().to_records(index=False))

my_dict = defaultdict(list)
for (year, price) in my_list:
    my_dict[year].append(float(price))

my_years, my_prices = [],[]
for year, prices in sorted(my_dict.items()):
    if len(prices) % 2 == 0:
        lower_mid = int(len(prices)/2 - 1)
        upper_mid = int(len(prices)/2)
        prices_sorted = sorted(prices)
        median_price = (prices_sorted[lower_mid] + prices_sorted[upper_mid]) / 2

    else:
        median_price = sorted(prices)[int(len(prices)/2)]

    print(f'{year}: {median_price}')
    my_years.append(year)
    my_prices.append(median_price)

plt.bar(my_years, my_prices)
plt.show()
4. Now calculate the mean price by year(still not using pandas code), and create a barplot with the price on the y-axis and year on the x-axis. Whoa! Something is odd here. Explain what is happening. Modify your code to use an if statement to "weed out" the likely erroneous value. Re-plot your values.
Click here for video (same as in Question 3)
Hint: It is also OK to use a built-in mean function, for instace: import statistics and the function statistics.mean
Relevant topics: sorted, for loops, if/else, list methods
Item(s) to submit:
- Python code used to solve the problem.
- Output from running your code.
- The barplot.
Solution
from collections import defaultdict

my_dict = defaultdict(list)
for (year, price) in my_list:
    my_dict[year].append(price)

my_years, my_prices = [],[]
for year, prices in sorted(my_dict.items()):
    print(f'{year}: {sum(prices)/len(prices)}')
    my_years.append(year)
    my_prices.append(sum(prices)/len(prices))

plt.bar(my_years, my_prices)
plt.show()
from collections import defaultdict
my_dict = defaultdict(list)
for (year, price) in my_list:
if price > 1_000_000:
continue
my_dict[year].append(price)
my_years, my_prices = [],[]
for year, prices in sorted(my_dict.items()):
avg_price = sum(prices)/len(prices)
print(f'{year}: {avg_price}')
my_years.append(year)
my_prices.append(avg_price)
plt.bar(my_years, my_prices)
plt.show()5. List comprehensions are a neat feature of Python that allows for a more concise syntax for smaller loops. While at first they may seem difficult and more confusing, eventually they grow on you. For example, say you wanted to capitalize every state in a list full of states:
my_states = myDF['state'].to_list()
my_states = [state.upper() for state in my_states]
Or, maybe you wanted to find the average price of cars in "excellent" condition (without pandas):
my_list = list(myDF.loc[:, ["condition", "price",]].dropna().to_records(index=False))
my_list = [price for (condition, price) in my_list if condition == "excellent"]
sum(my_list)/len(my_list)
Do the following using list comprehensions, and the provided code:
my_list = list(myDF.loc[:, ["state", "price",]].dropna().to_records(index=False))- Calculate the average price of vehicles from Indiana (
in). - Calculate the average price of vehicles from Indiana (
in), Michigan (mi), and Illinois (il) combined.
my_list = list(myDF.loc[:, ["manufacturer", "year", "price",]].dropna().to_records(index=False))- Calculate the average price of a "honda" (
manufacturer) that is 2010 or newer (year).
Relevant topics: sorted, for loops, if/else, list methods, sum, len, defaultdict, matplotlib
Item(s) to submit:
- Python code used to solve the problem.
- Output from running your code.
Solution
my_list = list(myDF.loc[:, ["state", "price",]].dropna().to_records(index=False))
my_list = [price for (state,price) in my_list if state == "in"]
print(sum(my_list)/len(my_list))

my_list = list(myDF.loc[:, ["state", "price",]].dropna().to_records(index=False))
my_list = [price for (state,price) in my_list if state in ('in', 'il', 'mi')]
print(sum(my_list)/len(my_list))

my_list = list(myDF.loc[:, ["manufacturer", "year", "price",]].dropna().to_records(index=False))
my_list = [p for (m, y, p) in my_list if m=='honda' and y >= 2010]
print(sum(my_list)/len(my_list))
6. Let's use a package called spacy to try and parse phone numbers out of the description column. First, simply loop through and print the text and the label. What is the label of the majority of the phone numbers you can see?
import spacy

# get list of descriptions
my_list = list(myDF.loc[:, ["description",]].dropna().to_records(index=False))
my_list = [m[0] for m in my_list]

# load the pre-built spacy model
nlp = spacy.load("en_core_web_lg")

# apply the model to a description
doc = nlp(my_list[0])

# print the text and label of each "entity"
for entity in doc.ents:
    print(entity.text, entity.label_)
Use an if statement to filter out all entities that are not the label you see. Loop through again and see what our printed data looks like. There is still a lot of data there that we don't want to capture, right? Phone numbers in the US are usually 7 (5555555), 8 (555-5555), 10 (5555555555), 11 (15555555555), 12 (555-555-5555), or 14 (1-555-555-5555) digits. In addition to your first "filter", add another "filter" that keeps only text where the text is one of those lengths.
That is starting to look better, but there are still some erroneous values. Come up with another "filter", and loop through our data again. Explain what your filter does and make sure that it does a better job on the first 10 documents than when we don't use your filter.
Note: If you get an error when trying to knit that talks about "unicode" characters, this is caused by trying to print special characters (non-ascii). An easy fix is just to remove all non-ascii text. You can do this with the encode string method. For example:
Instead of:
for entity in doc.ents:
    print(entity.text, entity.label_)
Do:
for entity in doc.ents:
print(entity.text.encode('ascii', errors='ignore'), entity.label_)Note: It can be fun to utilize machine learning and natural language processing, but that doesn't mean it is always the best solution! We could get rid of all of our filters and use regular expressions with much better results! We will demonstrate this in our solution.
Relevant topics: for loops
Item(s) to submit:
- Python code used to solve the problem.
- Output from running your code.
- 1-2 sentences explaining what your filter does.
Solution
import spacy

my_list = list(myDF.loc[:, ["description",]].dropna().to_records(index=False))
my_list = [m[0] for m in my_list]

# load the pre-built spacy model
nlp = spacy.load("en_core_web_lg")

for doc in my_list[:10]:
    d = nlp(doc)
    for entity in d.ents:
        print(entity.text.encode('ascii', errors='ignore'), entity.label_)

for doc in my_list[:10]:
    d = nlp(doc)
    for entity in d.ents:
        if entity.label_ == "CARDINAL":
            print(entity.text.encode('ascii', errors='ignore'), entity.label_)

for doc in my_list[:10]:
    d = nlp(doc)
    for entity in d.ents:
        if entity.label_ == "CARDINAL" and len(entity.text) in [7, 8, 10, 11, 12, 14]:
            print(entity.text.encode('ascii', errors='ignore'), entity.label_)

for doc in my_list[:10]:
    d = nlp(doc)
    for entity in d.ents:
        if entity.label_ == "CARDINAL" and len(entity.text) in [7, 8, 10, 11, 12, 14]:
            print(entity.text.encode('ascii', errors='ignore'), entity.label_)

import re
pattern = '\(?([0-9]{3})?\)?[-.]?([0-9]{3})[-.]?([0-9]{4})'
for doc in my_list[:10]:
    if matches := re.finditer(pattern, doc):
        for match in matches:
            print(match.group())
Project 5
Motivation: Up until this point we've utilized bits and pieces of the pandas library to perform various tasks. In this project we will formally introduce pandas and numpy, and utilize their capabilities to solve data-driven problems.
Context: By now you'll have had some limited exposure to pandas. This is the first in a three project series that covers some of the main components of both the numpy and pandas libraries. We will take a two project intermission to learn about functions, and then continue.
Scope: python, pandas, numpy, DataFrames, Series, ndarrays, indexing
Learning objectives:
- Distinguish the differences between numpy, pandas, DataFrames, Series, and ndarrays.
- Use numpy, scipy, and pandas to solve a variety of data-driven problems.
- Demonstrate the ability to read and write data of various formats using various packages.
- View and access data inside DataFrames, Series, and ndarrays.
Make sure to read about, and use the template found here, and the important information about projects submissions here.
Dataset
The following questions will use the dataset found in Scholar:
/class/datamine/data/stackoverflow/unprocessed/2018.csv
/class/datamine/data/stackoverflow/unprocessed/2018.parquet
/class/datamine/data/stackoverflow/unprocessed/2018.feather
Questions
1. Take a look at the pandas docs. There are a lot of formats that pandas has the ability to read. The most popular formats in this course are: csv (with commas or some other separator), excel, json, or some database. CSV is very prevalent, but it was not designed to work well with large amounts of data. Newer formats like parquet and feather are designed from the ground up to be efficient, and take advantage of special processor instruction set called SIMD. The benefits of using these formats can be significant. Let's do some experiments!
How much space do each of the following files take up on Scholar: 2018.csv, 2018.parquet, and 2018.feather? How much smaller (as a percentage) is the parquet file than the csv? How much smaller (as a percentage) is the feather file than the csv? Use f-strings to format the percentages.
Time reading in the following files: 2018.csv, 2018.parquet, and 2018.feather. How much faster (as a percentage) is reading the parquet file than the csv? How much faster (as a percentage) is reading the feather file than the csv? Use f-strings to format the percentages.
To time a piece of code, you can use the block-timer package:
from block_timer.timer import Timer

with Timer(title="Using dict to declare a dict") as t1:
    my_dict = dict()

with Timer(title="Using {} to declare a dict") as t2:
    my_dict = {}

# or if you need more fine-tuned values
print(t1.elapsed)
print(t2.elapsed)
Read the 2018.csv file into a pandas DataFrame called my2018. Time writing the contents of my2018 to the following files: 2018.csv, 2018.parquet, and 2018.feather. Write the files to your scratch directory: /scratch/scholar/<username>, where <username> is your username. How much faster (as a percentage) is writing the parquet file than the csv? How much faster (as a percentage) is writing the feather file than the csv? Use f-strings to format the percentages.
Relevant topics: pandas read_csv, pandas to_csv
Item(s) to submit:
- Python code used to solve the problem.
- Output from running your code.
Solution
import pandas as pd
from block_timer.timer import Timer

with Timer(title="csv") as csv:
    myDF = pd.read_csv("/class/datamine/data/stackoverflow/unprocessed/2018.csv")

with Timer(title="parquet") as parquet:
    myDF = pd.read_parquet("/class/datamine/data/stackoverflow/unprocessed/2018.parquet")

with Timer(title="feather") as feather:
    myDF = pd.read_feather("/class/datamine/data/stackoverflow/unprocessed/2018.feather")

print(f'Reading parquet is {csv.elapsed/parquet.elapsed-1.0:.2%} faster than csv.')
print(f'Reading feather is {csv.elapsed/feather.elapsed-1.0:.2%} faster than csv.')
from block_timer.timer import Timer
myDF = pd.read_csv("/class/datamine/data/stackoverflow/unprocessed/2018.csv")
with Timer(title="csv") as csv:
myDF.to_csv("/scratch/scholar/kamstut/2018.csv")
with Timer(title="parquet") as parquet:
myDF.to_parquet("/scratch/scholar/kamstut/2018.parquet")
with Timer(title="feather") as feather:
myDF.to_feather("/scratch/scholar/kamstut/2018.feather")
print(f'Writing parquet is {csv.elapsed/parquet.elapsed-1.0:.2%} faster than csv.')
print(f'Writing feather is {csv.elapsed/feather.elapsed-1.0:.2%} faster than csv.')from pathlib import Path
csv = Path('/class/datamine/data/stackoverflow/unprocessed/2018.csv').stat().st_size
parquet = Path('/class/datamine/data/stackoverflow/unprocessed/2018.parquet').stat().st_size
feather = Path('/class/datamine/data/stackoverflow/unprocessed/2018.feather').stat().st_size
print(f'The parquet file is {csv/parquet:.2%} smaller than csv.')
print(f'Writing feather is {csv/feather:.2%} smaller than csv.')2. A method is just a function associated with an object or class. For example, mean is just a method of the pandas DataFrame:
# myDF is an object of class DataFrame
# mean is a method of the DataFrame class
myDF.mean()
In pandas there are two main methods used for indexing: loc and iloc. Use the column Student and indexing in pandas to calculate what percentage of respondents are students and not students. Consider the respondent to be a student if the Student column is anything but "No". Create a new DataFrame called not_students that is a subset of the original dataset without students.
Relevant topics: loc/iloc/indexing
Item(s) to submit:
- Python code used to solve the problem.
- Output from running your code.
Solution
not_students = myDF.loc[myDF.loc[:,"Student"]=="No",:]
not_student_percent = len(not_students.loc[:, "Respondent"])/len(myDF.loc[:, "Respondent"])
student_percent = 1-not_student_percent
print(f"Percent not students: {not_student_percent}")
print(f"Percent students: {student_percent}")
3. In pandas, if you were to isolate a single column using indexing, like this:
myDF.loc[:, "Student"]The result would be a pandas Series. A Series is the 1-dimensional equivalent of a DataFrame.
type(myDF.loc[:, "Student"]) # pandas.core.series.Seriespandas and numpy make it very easy to convert between a Series, ndarray, and list. Here is a very useful graphic to highlight how to do this. Look at the DevType column in not_students. As you can see, a single value may contain a list of semi-colon-separated professions. Create a list with a unique group of all the possible professions. Consider each semi-colon-separated value a profession. How many professions are there?
It looks like somehow the profession "Student" got in there even though we filtered by the Student column. Use not_students to get a subset of our data for which the respondents replied "No" to Student, yet put "Student" as one of many possible DevTypes. How many respondents are in that subset?
Hint: If you have a column containing strings in pandas, and would like to use string methods on every string in the column, you can use .str. For example:
# this would use the `strip` string method on each value in myColumn, and compare them to ''
# `contains` is another useful string method...
myDF.loc[myDF.loc[:, "myColumn"].str.strip() == '', :]
Hint: See here.
Relevant topics: list comprehensions, for loops, loc/iloc/indexing
Item(s) to submit:
- Python code used to solve the problem.
- Output from running your code.
- The number of professions there are.
-
The number of respondents that replied "No" to
Student, yet put "Student" as theDevType.
Solution
professions = [p.split(";") for p in not_students.loc[:, "DevType"].dropna().tolist()]

# unnest the nested lists
professions = [p for li in professions for p in li]
professions = list(set(professions))

print(professions)
print(len(professions))
result = myDF.loc[(myDF.loc[:, "Student"]=="No") & (myDF.loc[:, "DevType"].str.contains("Student")),:]
len(result)4. As you can see, while perhaps a bit more strict, indexing in pandas is not that much more difficult than indexing in R. While not always necessary, remembering to put ":" to indicate "all columns" or "all rows" makes life easier. In addition, remembering to put parentheses around logical groupings is also a good thing. Practice makes perfect! Randomly select 100 females and 100 males. How many of each sample is in each Age category? (Do not use the sample method yet, but instead use numeric indexing and random)
import random

print(f"A random integer between 1 and 100 is {random.randint(1, 101)}")
## A random integer between 1 and 100 is 37It would be nice to visualize these results. pandas Series have some built in methods to create plots. Use [this] method to generate a bar plot for both females and males. How do they compare?
Hint: You may need to import matplotlib in order to display the graphic:
import matplotlib.pyplot as plt

# female barplot code here
plt.show()

# male barplot code here
plt.show()Hint: Once you have your female and male DataFrames, the value_counts method found here may be particularly useful.
Relevant topics: list comprehensions, for loops, loc/iloc/indexing, barplot
Item(s) to submit:
- Python code used to solve the problem.
- Output from running your code.
Solution
import random
import matplotlib.pyplot as plt


males = myDF.loc[(myDF.loc[:, "Gender"]=="Male"), :]
random_indices = [random.randint(0, len(males)) for i in range(0,100)]
males = males.iloc[random_indices, ]
print(males.loc[:,"Age"].value_counts())

females = myDF.loc[(myDF.loc[:, "Gender"]=="Female"), :]
random_indices = [random.randint(0, len(females)) for i in range(0,100)]
females = females.iloc[random_indices]
print(females.loc[:,"Age"].value_counts())

males.loc[:,"Age"].value_counts().plot.bar()
plt.show()

females.loc[:,"Age"].value_counts().plot.bar()
plt.show()
5. pandas really helps out when it comes to working with data in Python. This is a really cool dataset, use your newfound skills to do a mini-analysis. Your mini-analysis should include 1 or more graphics, along with some interesting observation you made while exploring the data.
Relevant topics:
Item(s) to submit:
- Python code used to solve the problem.
- Output from running your code.
- A graphic.
- 1-2 sentences explaining your interesting observation and graphic.
Solution
Could be anything.
Project 6
Motivation: Being able to analyze and create good visualizations is a skill that is invaluable in many fields. It can be pretty fun too! In this project, we are going to take a small hiatus from the regular stream of projects to do some data visualizations.
Context: We've been working hard all semester and learning valuable skills. In this project we are going to ask you to examine some plots, write a little bit, and use your creative energies to create good visualizations about the flight data.
Scope: python, r, visualizing data
Learning objectives:
- Demostrate the ability to create basic graphs with default settings.
- Demonstrate the ability to modify axes labels and titles.
- Demonstrate the ability to customize a plot (color, shape/linetype).
Make sure to read about, and use the template found here, and the important information about projects submissions here.
Dataset
The following questions will use the dataset found in Scholar:
/class/datamine/data/flights/*.csv (all csv files)
Questions
2. Creating More Effective Graphs by Dr. Naomi Robbins and The Elements of Graphing Data by Dr. William Cleveland at Purdue University, are two excellent books about data visualization. Read the following excerpts from the books (respectively), and list 2 things you learned, or found interesting from each book.
Item(s) to submit:
- Two bullets for each book with items you learned or found interesting.
3. Of the 7 posters with at least 3 plots and/or maps, choose 1 poster that you think you could improve upon or "out plot". Create 4 plots/maps that either:
- Improve upon a plot from the poster you chose, or
- Show a completely different plot that does a good job of getting an idea or observation across, or
- Ruin a plot. Purposefully break the best practices you've learned about in order to make the visualization misleading. (limited to 1 of the 4 plots)
For each plot/map where you choose to do (1), include 1-2 sentences explaining what exactly you improved upon and how. Point out some of the best practices from the 2 provided texts that you followed. For each plot/map where you choose to do (2), include 1-2 sentences explaining your graphic and outlining the best practices from the 2 texts that you followed. For each plot/map where you choose to do (3), include 1-2 sentences explaining what you changed, what principle it broke, and how it made the plot misleading or worse.
While we are not asking you to create a poster, please use RMarkdown to keep your plots, code, and text nicely formatted and organized. The more like a story your project reads, the better. You are free to use either R or Python or both to complete this project. Please note that it would be unadvisable to use an interactive plotting package like plotly, as these packages will not render plots from within RMarkdown in RStudio.
Some useful R packages:
- base R functions: bar, plot, lines, etc.
- usmap
- ggplot
Some useful Python packages:
Item(s) to submit:
- All associated R/Python code you used to wrangling the data and create your graphics.
- 4 plots, with at least 4 associated RMarkdown code chunks.
- 1-2 sentences per plot explaining what exactly you improved upon, what best practices from the texts you used, and how. If it is a brand new visualization, describe and explain your graphic, outlining the best practices from the 2 texts that you followed. If it is the ruined plot you chose, explain what you changed, what principle it broke, and how it made the plot misleading or worse.
4. Now that you've been exploring data visualization, copy, paste, and update your first impressions from question (1) with your updated impressions. Which impression changed the most, and why?
Item(s) to submit:
- 8 bullets with updated impressions (still just a sentence or two) from question (1).
- A sentence explaining which impression changed the most and why.
Project 7
Motivation: There is one pretty major topic that we have yet to explore in Python -- functions! A key component to writing efficient code is writing functions. Functions allow us to repeat and reuse coding steps that we used previously, over and over again. If you find you are repeating code over and over, a function may be a good way to reduce lots of lines of code.
Context: We are taking a small hiatus from our pandas and numpy focused series to learn about and write our own functions in Python!
Scope: python, functions, pandas
Learning objectives:
- Comprehend what a function is, and the components of a function in Python.
- Differentiate between positional and keyword arguments.
Make sure to read about, and use the template found here, and the important information about projects submissions here.
Dataset
The following questions will use the dataset found in Scholar:
/class/datamine/data/yelp/data/parquet
Questions
1. You've been given a path to a folder for a dataset. Explore the files. Give a brief description of the files and what each file contains.
Note: Take a look at the size of each of the files. If you are interested in experimenting, try using pandas read_json function to read the yelp_academic_dataset_user.json file in the json folder /class/datamine/data/yelp/data/json/yelp_academic_dataset_user.json. Even with the large amount of memory available to you, this should fail. In order to make it work you would need to use the chunksize option to read the data in bit by bit. Now consider that the reviews.parquet file is .3gb larger than the yelp_academic_dataset_user.json file, but can be read in with no problem. That is seriously impressive!
Relevant topics: read_parquet
Item(s) to submit:
- Python code used to solve the problem.
- Output from running your code.
- The name of each dataset and a brief summary of each dataset. No more than 1-2 sentences about each dataset.
Solution
2. Read the businesses.parquet file into a pandas DataFrame called businesses. Take a look to the hours and attributes columns. If you look closely, you'll observe that both columns contain a lot more than a single feature. In fact, the attributes column contains 39 features and the hours column contains 7!
len(businesses.loc[:, "attributes"].iloc[0].keys()) # 39
len(businesses.loc[:, "hours"].iloc[0].keys()) # 7
Let's start by writing a simple function. Create a function called has_attributes that takes a business_id as an argument, and returns True if the business has any attributes and False otherwise. Test it with the following code:
print(has_attributes('f9NumwFMBDn751xgFiRbNA')) # True
print(has_attributes('XNoUzKckATkOD1hP6vghZg')) # False
print(has_attributes('Yzvjg0SayhoZgCljUJRF9Q')) # True
print(has_attributes('7uYJJpwORUbCirC1mz8n9Q')) # False
While this is useful to get whether or not a single business has any attributes, if you wanted to apply this function to the entire attributes column/Series, you would just use the notna method:
businesses.loc[:, "attributes"].notna()Important note: Make sure your return value is of type bool. To check this:
type(True) # bool
type("True") # strRelevant topics: pandas indexing, functions
Item(s) to submit:
- Python code used to solve the problem.
- Output from running the provided "test" code.
3. Take a look at the attributes of the first business:
businesses.loc[:, "attributes"].iloc[0]What is the type of the value? Let's assume the company you work for gets data formatted like businesses each week, but your boss wants the 39 features in attributes and the 7 features in hours to become their own columns. Write a function called fix_businesses_data that accepts an argument called data_path (of type str) that is a full path to a parquet file that is in the exact same format as businesses.parquet. In addition to the data_path argument, fix_businesses_data should accept another argument called output_dir (of type str). output_dir should contain the path where you want your "fixed" parquet file to output. fix_businesses_data should return None.
The result of your function, should be a new file called new_businesses.parquet saved in the output_dir, the data in this file should no longer contain either the attributes or hours columns. Instead, each row should contain 39+7 new columns. Test your function out:
from pathlib import Path

my_username = "kamstut" # replace "kamstut" with YOUR username
fix_businesses_data(data_path="/class/datamine/data/yelp/data/parquet/businesses.parquet", output_dir=f"/scratch/scholar/{my_username}")

# see if output exists
p = Path(f"/scratch/scholar/{my_username}").glob('**/*')
files = [x for x in p if x.is_file()]
print(files)
Important note: Make sure that either /scratch/scholar/{my_username} or /scratch/scholar/{my_username}/ will work as arguments to output_dir. If you use the pathlib library, as shown in the provided function "skeleton" below, both will work automatically!
from pathlib import Path

def fix_businesses_data(data_path: str, output_dir: str) -> None:
    """
    fix_data accepts a parquet file that contains data in a specific format.
    fix_data "explodes" the attributes and hours columns into 39+7=46 new
    columns.
    Args:
        data_path (str): Full path to a file in the same format as businesses.parquet.
        output_dir (str): Path to a directory where new_businesses.parquet should be output.
    """
    # read in original parquet file
    businesses = pd.read_parquet(data_path)

    # unnest the attributes column

    # unnest the hours column

    # output new file
    businesses.to_parquet(str(Path(f"{output_dir}").joinpath("new_businesses.parquet")))

return NoneHint: Check out the code below, notice how using pathlib handles whether or not we have the trailing /.
from pathlib import Path

print(Path("/class/datamine/data/").joinpath("my_file.txt"))
print(Path("/class/datamine/data").joinpath("my_file.txt"))
Hint: You can test out your function on /class/datamine/data/yelp/data/parquet/businesses_sample.parquet to not waste as much time.
Hint: If we were using R and the tidyverse package, this sort of behavior is called "unnesting". You can read more about it here.
Hint: This stackoverflow post should be very useful! Specifically, run this code and take a look at the output:
businesses
businesses.loc[0:4, "attributes"].apply(pd.Series)
Notice that some rows have json, and others have None:
businesses.loc[0, "attributes"] # has json
businesses.loc[2, "attributes"] # has None
This method allows us to handle both cases. If the row has json it converts the values, if it has None it just puts each column with a value of None.
Hint: Here is an example that shows you how to concatenate (combine) dataframes.
Relevant topics: pandas indexing, functions, concat, apply
Item(s) to submit:
- Python code used to solve the problem.
- Output from running your code.
4. That's a pretty powerful function, and could definitely be useful. What if, instead of working on just our specifically formatted parquet file, we wrote a function that worked for any pandas DataFrame? Write a function called unnest that accepts a pandas DataFrame as an argument (let's call this argument myDF), and a list of columns (let's call this argument columns), and returns a DataFrame where the provided columns are unnested.
Important note: You may write unnest so that the resulting dataframe contains the original dataframe and the unnested columns, or you may return just the unnested columns -- both will be accepted solutions.
Hint: The following should work:
businesses = pd.read_parquet("/class/datamine/data/yelp/data/parquet/businesses.parquet")

new_businesses_df = unnest(businesses, ["attributes", ])
new_businesses_df.shape # (209393, 39)
new_businesses_df.head()

new_businesses_df = unnest(businesses, ["attributes", "hours"])
new_businesses_df.shape # (209393, 46)
new_businesses_df.head()
Relevant topics: pandas indexing, functions, apply, drop
Item(s) to submit:
- Python code used to solve the problem.
- Output from running the provided code.
5. Try out the code below. If a provided column isn't already nested, the column name is ruined and the data is changed. If the column doesn't already exist, a KeyError is thrown. Modify our function from question (4) to skip unnesting if the column doesn't exist. In addition, modify the function from question (4) to skip the column if the column isn't nested. Let's consider a column nested if the value of the column is a dict, and not nested otherwise.
businesses = pd.read_parquet("/class/datamine/data/yelp/data/parquet/businesses.parquet")

new_businesses_df = unnest(businesses, ["doesntexist",]) # KeyError
new_businesses_df = unnest(businesses, ["postal_code",]) # not nested
To test your code, run the following. The result should be a DataFrame where attributes has been unnested, and that is it.
businesses = pd.read_parquet("/class/datamine/data/yelp/data/parquet/businesses.parquet")
results = unnest(businesses, ["doesntexist", "postal_code", "attributes"])
results.shape # (209393, 39)
results.head()Hint: To see if a variable is a dict you could use type:
my_variable = {'key': 'value'}
type(my_variable)
## <class 'dict'>Relevant topics: pandas indexing, functions, apply, drop
Item(s) to submit:
- Python code used to solve the problem.
- Output from running the provided code.
Project 8
Motivation: A key component to writing efficient code is writing functions. Functions allow us to repeat and reuse coding steps that we used previously, over and over again. If you find you are repeating code over and over, a function may be a good way to reduce lots of lines of code. There are some pretty powerful features of functions that we have yet to explore that aren't necessarily present in R. In this project we will continue to learn about and harness the power of functions to solve data-driven problems.
Context: We are taking a small hiatus from our pandas and numpy focused series to learn about and write our own functions in Python!
Scope: python, functions, pandas
Learning objectives:
- Comprehend what a function is, and the components of a function in Python.
- Differentiate between positional and keyword arguments.
- Learn about packing and unpacking variables and arguments.
Make sure to read about, and use the template found here, and the important information about projects submissions here.
Dataset
The following questions will use the dataset found in Scholar:
/class/datamine/data/yelp/data/parquet
Questions
1. The company you work for is assigning you to the task of building out some functions for the new API they've built. Please load these two pandas DataFrame's:
users = pd.read_parquet("/class/datamine/data/yelp/data/parquet/users.parquet")
reviews = pd.read_parquet("/class/datamine/data/yelp/data/parquet/reviews.parquet")
You do not need these four DataFrames in this project.
photos = pd.read_parquet("/class/datamine/data/yelp/data/parquet/photos.parquet")
businesses = pd.read_parquet("/class/datamine/data/yelp/data/parquet/businesses.parquet")
checkins = pd.read_parquet("/class/datamine/data/yelp/data/parquet/checkins.parquet")
tips = pd.read_parquet("/class/datamine/data/yelp/data/parquet/tips.parquet")
You would expect that friends may have a similar taste in restaurants or businesses. Write a function called get_friends_data that accepts a user_id as an argument, and returns a pandas DataFrame with the information in the users DataFrame for each friend of user_id. Look at the solutions from the previous project, as well as this page. Add type hints for your function. You should have a type hint for our argument, user_id, as well as a type hint for the returned data. In addition to type hints, make sure to document your function with a docstring.
Hint: Every function in the solutions for last week's projects has a docstring. You can use this as a reference.
Hint: You should get the same number of friends for the following code:
print(get_friends_data("ntlvfPzc8eglqvk92iDIAw").shape) # (13,22)
print(get_friends_data("AY-laIws3S7YXNl_f_D6rQ").shape) # (1, 22)
print(get_friends_data("xvu8G900tezTzbbfqmTKvA").shape) # (193,22)
Note: It is sufficient to just load the first of these three examples, when you Knit your project (to save time during Knitting).
Relevant topics: pandas indexing, functions
Item(s) to submit:
- Python code used to solve the problem.
- Output from running your code.
2. Write a function called calculate_avg_business_stars that accepts a business_id and returns the average number of stars that business received in reviews. Like in question (1) make sure to add type hints and docstrings. In addition, add comments when (and if) necessary.
There is a really cool method that gives us the same "powers" that tapply gives us in R. Use the groupby method from pandas to calculate the average stars for all businesses. Index the result to confirm that your calculate_avg_business_stars function worked properly.
Hint: You should get the same average number of start value for the following code:
print(calculate_avg_business_stars("f9NumwFMBDn751xgFiRbNA")) # 3.1025641025641026Relevant topics: pandas indexing, functions, groupby, numpy.mean()
Item(s) to submit:
- Python code used to solve the problem.
- Output from running your code.
3. Write a function called visualize_stars_over_time that accepts a business_id and returns a line plot that shows the average number of stars for each year the business has review data. Like in previous questions, make sure to add type hints and docstrings. In addition, add comments when (and if) necessary. You can test your function with some of these:
visualize_stars_over_time('RESDUcs7fIiihp38-d6_6g')Relevant topics: pandas indexing, functions, matplotlib lineplot
Item(s) to submit:
- Python code used to solve the problem.
- Output from running your code.
4. Modify question (3), and add an argument called granularity that dictates whether the plot will show the average rating over years, or months. granularity should accept one of two strings: "years", or "months". By default, if granularity isn't specified, it should be "years".
visualize_stars_over_time('RESDUcs7fIiihp38-d6_6g', "months")Relevant topics: pandas indexing, functions, matplotlib lineplot
Item(s) to submit:
- Python code used to solve the problem.
- Output from running your code.
5. Modify question (4) to accept multiple business_id's, and create a line for each id. Each of the following should work:
visualize_stars_over_time("RESDUcs7fIiihp38-d6_6g", "4JNXUYY8wbaaDmk3BPzlWw", "months")
visualize_stars_over_time("RESDUcs7fIiihp38-d6_6g", "4JNXUYY8wbaaDmk3BPzlWw", "K7lWdNUhCbcnEvI0NhGewg", "months")
visualize_stars_over_time("RESDUcs7fIiihp38-d6_6g", "4JNXUYY8wbaaDmk3BPzlWw", "K7lWdNUhCbcnEvI0NhGewg", granularity="years")
Hint: Use plt.show to decide when to show your complete plot and start anew.
Note: It is sufficient to just load the first of these three examples, when you Knit your project (to save time during Knitting).
Relevant topics: pandas indexing, functions, matplotlib lineplot
Item(s) to submit:
- Python code used to solve the problem.
- Output from running your code.
6. After some thought, your boss decided that using the function from question (5) would get pretty tedious when there are a lot of businesses to include in the plot. You disagree. You think there is a way to pass a list of business_ids without modifying your function, but rather how you pass the arguments to the function. Demonstrate how to do this with the list provided:
our_businesses = ["RESDUcs7fIiihp38-d6_6g", "4JNXUYY8wbaaDmk3BPzlWw", "K7lWdNUhCbcnEvI0NhGewg"]

# modify something below to make this work:
visualize_stars_over_time(our_businesses, granularity="years")
Hint: Google "python packing unpacking arguments".
Relevant topics: pandas indexing, functions, matplotlib lineplot
Item(s) to submit:
- Python code used to solve the problem.
- Output from running your code.
Project 9
Motivation: We've covered a lot of material in a very short amount of time. At this point in time, you have so many powerful tools at your disposal. Last semester in project 14 we used our new skills to build a beer recommendation system. It is pretty generous to call what we built a recommendation system. In the next couple of projects, we will use our Python skills to build a real beer recommendation system!
Context: At this point in the semester we have a solid grasp on Python basics, and are looking to build our skills using the pandas and numpy packages to build a data-driven recommendation system for beers.
Scope: python, pandas, numpy
Learning objectives:
- Distinguish the differences between numpy, pandas, DataFrames, Series, and ndarrays.
- Use numpy, scipy, and pandas to solve a variety of data-driven problems.
- Demonstrate the ability to read and write data of various formats using various packages.
- View and access data inside DataFrames, Series, and ndarrays.
Make sure to read about, and use the template found here, and the important information about projects submissions here.
Dataset
The following questions will use the dataset found in Scholar:
/class/datamine/data/beer
Load the following datasets up and assume they are always available:
beers = pd.read_parquet("/class/datamine/data/beer/beers.parquet")
breweries = pd.read_parquet("/class/datamine/data/beer/breweries.parquet")
reviews = pd.read_parquet("/class/datamine/data/beer/reviews.parquet")
Questions
1. Write a function called prepare_data that accepts an argument called myDF that is a pandas DataFrame. In addition, prepare_data should accept an argument called min_num_reviews that is an integer representing the minimum amount of reviews that the user and the beer must have, to be included in the data. The function prepare_data should return a pandas DataFrame with the following properties:
First remove all rows where score or username or beer_id is missing, like this:
    myDF = myDF.loc[myDF.loc[:, "score"].notna(), :]
    myDF = myDF.loc[myDF.loc[:, "username"].notna(), :]
    myDF = myDF.loc[myDF.loc[:, "beer_id"].notna(), :]
    myDF.reset_index(drop=True)
Among the remaining rows, choose the rows of myDF that have a user (username) and a beer_id that each occur at least min_num_reviews times in myDF.
train = prepare_data(reviews, 1000)
print(train.shape) # (952105, 10)
Hint: We added two examples of how to do this with the election data (instead of the beer review data) in the book: cleaning and filtering data
Relevant topics: indexing in pandas, isin, notna
Item(s) to submit:
- Python code used to solve the problem.
- Output from running your code.
Solution
def prepare_data(myDF, min_num_reviews):

    # remove rows where score is na
    myDF = myDF.loc[myDF.loc[:, "score"].notna(), :]
    # get a list of usernames that have at least min_num_reviews
    usernames = myDF.loc[:, "username"].value_counts() >= min_num_reviews
    usernames = usernames.loc[usernames].index.values.tolist()
    # get a list of beer_ids that have at least min_num_reviews
    beerids = myDF.loc[:, "beer_id"].value_counts() >= min_num_reviews
    beerids = beerids.loc[beerids].index.values.tolist()
    # first remove all rows where the username has less than min_num_reviews
    myDF = myDF.loc[myDF.loc[:, "username"].isin(usernames), :]

    # remove rows where the beer_id has less than min_num_reviews
    myDF = myDF.loc[myDF.loc[:, "beer_id"].isin(beerids), :]

    return myDF
train = prepare_data(reviews, 1000)
2. Run the function in question (1). Use train=prepare_data(reviews, 1000). The basis of our recommendation system will be to "match" a user to another user will similar taste in beer. Different users will have different means and variances in their scores. If we are going to compare users' scores, we should standardize users' scores. Update the train DataFrame with 1 additional column: standardized_score. To calculate the standardized_score, take each individual score, and subtract off the user's average score and divide that result by the user's score's standard deviation.
In R, we have the following code:
myDF <- data.frame(a=c(1,2,3,1,2,3), b=c(6,5,4,5,5,5), c=c(9,9,9,8,8,8))
myMean = tapply(myDF$b + myDF$c, myDF$a, mean)
myMeanDF = data.frame(a=as.numeric(names(myMean)), mean=myMean)
myDF = merge(myDF, myMeanDF, by='a')
Or you could also use a very handy package called tidyverse in R to do the same thing:
library(tidyverse)
myDF <- data.frame(a=c(1,2,3,1,2,3), b=c(6,5,4,5,5,5), c=c(9,9,9,8,8,8))
myDF %>%
    group_by(a) %>%
    mutate(d=mean(b+c))
Unfortunately, there isn't a great way to do this in Python:
def summer(data):
    data['d'] = (data['b']+data['c']).mean()
    return data

myDF = myDF.groupby(["a"]).apply(summer)
Create a new column standardized_score. Calculate the standardized_score by taking the score and subtracting the average score, then divide by the standard deviation. As it may take a minute or two to create this new column, feel free to test it on a small sample of the reviews DataFrame:
import pandas as pd
testDF = pd.read_parquet('/class/datamine/data/beer/reviews_sample.parquet')
Hint: Don't forget about the pandas DataFrame std and mean methods.
Note: If you are worried about getting NAs, do not worry. The only way we would get NAs would be if there is only a single review for the user (which we took care of by limiting to users with at least 1000 reviews), or if there is no variance in a user's scores (which doesn't happen).
Note: We added an example about how to do this with the election data in the book: standardizing data example
Relevant topics: groupby, functions, mean, std
Item(s) to submit:
- Python code used to solve the problem.
- Output from running your code.
Solution
def mutate_std_score(data: pd.DataFrame) -> pd.DataFrame:
    """
    mutate_std_score is a function to use in conjunction with
    pd.apply and pd.groupby to create a new column that is
    the standardized score.
    Args:
        data (pd.DataFrame): A pandas DataFrame.
    Returns:
        pd.DataFrame: A modified pandas DataFrame.
    """
    data['standardized_score'] = (data['score'] - data['score'].mean())/data['score'].std()
    return data
train = train.groupby(["username"]).apply(mutate_std_score)
3. Use the pivot_table method from pandas to put your train data into "wide" format. What this means is that each row in the new DataFrame will be a username, and each column will be a beer_id. Each cell will contain the standardized_score for the given username and beer combination. Call the resulting DataFrame score_matrix.
Relevant topics: pivot
Item(s) to submit:
- Python code used to solve the problem.
-
Output the
headandshapeofscore_matrix.
Solution
score_matrix = pd.pivot_table(train, values='standardized_score', index='username', columns='beer_id')
print(score_matrix.shape)
score_matrix.head()
4. The result from question (3) should be a sparse matrix (lots of missing data!). Let's fill in the missing data. For now, let's fill in a beer_id's missing data by filling in every missing value with the average score for the beer.
Hint: The fillna method in pandas will be very helpful!
Item(s) to submit:
- Python code used to solve the problem.
-
Output the
headofscore_matrix.
Solution
score_matrix = score_matrix.fillna(score_matrix.mean(axis=0))
score_matrix.head()
Congratulations! Next week, we will complete our recommendation system!
Project 10
Motivation: We've covered a lot of material in a very short amount of time. At this point in time, you have so many powerful tools at your disposal. Last semester in project 14 we used our new skills to build a beer recommendation system. It is pretty generous to call what we built a recommendation system. In the next couple of projects, we will use our Python skills to build a real beer recommendation system!
Context: This is the third project in a series of projects designed to learn about the pandas and numpy packages. In this project we build on to our previous project to finalize our beer recommendation system.
Scope: python, numpy, pandas
Learning objectives:
- Distinguish the differences between numpy, pandas, DataFrames, Series, and ndarrays.
- Use numpy, scipy, and pandas to solve a variety of data-driven problems.
- Demonstrate the ability to read and write data of various formats using various packages.
- View and access data inside DataFrames, Series, and ndarrays.
Make sure to read about, and use the template found here, and the important information about projects submissions here.
Dataset
The following questions will use the dataset found in Scholar:
/class/datamine/data/beer
Load the following datasets up and assume they are always available:
beers = pd.read_parquet("/class/datamine/data/beer/beers.parquet")
breweries = pd.read_parquet("/class/datamine/data/beer/breweries.parquet")
reviews = pd.read_parquet("/class/datamine/data/beer/reviews.parquet")
Previous project code:
Solution
def prepare_data(myDF, min_num_reviews):

    # remove rows where score is na
    myDF = myDF.loc[myDF.loc[:, "score"].notna(), :]
    # get a list of usernames that have at least min_num_reviews
    usernames = myDF.loc[:, "username"].value_counts() >= min_num_reviews
    usernames = usernames.loc[usernames].index.values.tolist()
    # get a list of beer_ids that have at least min_num_reviews
    beerids = myDF.loc[:, "beer_id"].value_counts() >= min_num_reviews
    beerids = beerids.loc[beerids].index.values.tolist()
    # first remove all rows where the username has less than min_num_reviews
    myDF = myDF.loc[myDF.loc[:, "username"].isin(usernames), :]

    # remove rows where the beer_id has less than min_num_reviews
    myDF = myDF.loc[myDF.loc[:, "beer_id"].isin(beerids), :]

    return myDF
train = prepare_data(reviews, 1000)
def mutate_std_score(data: pd.DataFrame) -> pd.DataFrame:
"""
mutate_std_score is a function to use in conjunction with
pd.apply and pd.groupby to create a new column that is
the standardized score.
Args:
data (pd.DataFrame): A pandas DataFrame.
Returns:
pd.DataFrame: A modified pandas DataFrame.
"""
data['standardized_score'] = (data['score'] - data['score'].mean())/data['score'].std()
return data
train = train.groupby(["username"]).apply(mutate_std_score)score_matrix = pd.pivot_table(train, values='standardized_score', index='username', columns='beer_id')
print(score_matrix.shape)
score_matrix.head()score_matrix = score_matrix.fillna(score_matrix.mean(axis=0))
score_matrix.head()Questions
1. If you struggled or did not do the previous project, or would like to start fresh, please see the solutions to the previous project (will be posted Saturday morning) and feel free to use them as your own. Cosine similarity is a measure of similarity between two non-zero vectors. It is used in a variety of ways in data science. Here is a pretty good article that tries to give some intuition into it. sklearn provides us with a function that calculates cosine similarity:
from sklearn.metrics.pairwise import cosine_similarityUse the cosine_similarity function on our score_matrix. The result will be a numpy array. Use the fill_diagonal method from numpy to fill the diagonals with 0. Convert the array back to a pandas DataFrame. Make sure to manually assign the indexes of the new DataFrame to be equal to score_matrix.index. Lastly, manually assign the columns to be score_matrix.index as well. The end result should be a matrix with usernames on both the x and y axes. Each value in the cell represents how "close" one user is to another. Normally the values in the diagonals would be 1 because the same user is 100% similar. To prevent this we forced the diagonals to be 0. Name the final result cosine_similarity_matrix.
Relevant topics: fill diagonal
Item(s) to submit:
- Python code used to solve the problem.
-
headofcosine_similarity_matrix.
2. Write a function called get_knn that accepts the cosine_similarity_matrix, a username, and a value, k. The function get_knn should return a pandas Series or list containing the usernames of the k most similar users to the input username.
Hint: This may sound difficult, but it is not. It really only involves sorting some values and grabbing the first k.
Test it on the following; we demonstrate the output if you return a list:
k_similar=get_knn(cosine_similarity_matrix,"2GOOFY",4)
print(k_similar) # ['Phil-Fresh', 'mishi_d', 'SlightlyGrey', 'MI_beerdrinker']Relevant topics: writing functions, sort values, indexing
Item(s) to submit:
- Python code used to solve the problem.
- Output from running your code.
3. Let's test get_knn to see if the results make sense. Pick out a user, and the most similar other user. First, get a DataFrame (let's call it aux) containing just their reviews. The result should be a DataFrame that looks just like the reviews DataFrame, but just contains your users' reviews.
Next, look at aux. Wouldn't it be nice to get a DataFrame where the beer_id is the row index, the first column contains the scores for the first user, and the second column contains the scores for the second user? Use the pivot_table method to accomplish this, and save the result as aux.
Lastly, use the dropna method to remove all rows where at least one of the users has an NA value. Sort the values in aux using the sort_values method. Take a look at the result and write 1-2 sentences explaining whether or not you think the users rated the beers similarly.
Hint: You could also create a scatter plot using the resulting DataFrame. If it is a good match the plot should look like a positive sloping line.
Relevant topics: sort values, indexing, pivot_table, isin
Item(s) to submit:
- Python code used to solve the problem.
- Output from running your code.
- 1-2 sentences explaining whether or not you think the users rated the beers similarly.
4. We are so close, and things are looking good! The next step for our system, is to write a function that finds recommendations for a given user. Write a function called recommend_beers, that accepts three arguments: the train DataFrame, a username, a cosine_similarity_matrix, and k (how many neighbors to use). The function recommend_beers should return the top 5 recommendations.
Calculate the recommendations by:
- Finding the
knearest neighbors of the inputusername. - Get a DataFrame with all of the reviews from
trainfor every neighbor. Let's call thisaux. - Get a list of all
beer_ids that the user withusernamehas reviewed. - Remove all beers from
auxthat have already been reviewed by the user withusername. - Group by
beer_idand calculate the meanstandardized_score. - Sort the results in descending order, and return the top 5
beer_ids.
Test it on the following:
recommend_beers(train, "22Blue", cosine_similarity_matrix, 30) # [40057, 69522, 22172, 59672, 86487]Relevant topics: writing functions, sort values, indexing, isin
Item(s) to submit:
- Python code used to solve the problem.
- Output from running your code.
5. (optional, 0 pts) Improve our recommendation system! Below are some suggestions, don't feel limited by them:
- Instead of returning a list of
beer_ids, return the beer info from thebeersdataset. - Remove all retired beers.
- Somehow add a cool plot.
- Etc.
Relevant topics: writing functions, sort values, indexing
Item(s) to submit:
- Python code used to solve the problem.
- Output from running your code.
Project 11
Motivation: We've had a pretty intense series of projects recently, and, although you may not have digested everything fully, you may be surprised at how far you've come! What better way to realize this but to take a look at some familiar questions that you've solved in the past in R, and solve them in Python instead? You will (a) have the solutions in R to be able to compare and contrast what you come up with in Python, and (b) be able to fill in any gaps you find you have along the way.
Context: We've just finished a two project series where we built a beer recommendation system using Python. In this project, we are going to take a (hopefully restful) step back and tackle some familiar data wrangling tasks, but in Python instead of R.
Scope: python, r
Learning objectives:
- Use numpy, scipy, and pandas to solve a variety of data-driven problems.
- Demonstrate the ability to read and write data of various formats using various packages.
Make sure to read about, and use the template found here, and the important information about projects submissions here.
Dataset
The following questions will use the dataset found in Scholar:
/class/datamine/data/fars
Questions
1. The fars dataset contains a series of folders labeled by year. In each year folder there is (at least) the files ACCIDENT.CSV, PERSON.CSV, and VEHICLE.CSV. If you take a peek at any ACCIDENT.CSV file in any year, you'll notice that the column YEAR only contains the last two digits of the year. Add a new YEAR column that contains the full year. Use the pd.concat function to create a DataFrame called accidents that combines the ACCIDENT.CSV files from the years 1975 through 1981 (inclusive) into one big dataset. After (or before) creating that accidents DataFrame, change the values in the YEAR column from two digits to four digits (i.e., paste a 19 onto each year value).
Hint: One way to append strings to every value in a column is to first convert the column to str using astype and then use the + operator, like normal:
myDF["myCol"].astype(str) + "appending_this_string"Relevant topics: pandas concat, loops
Item(s) to submit:
- Python code used to solve the problem.
-
headof theaccidentsdataframe.
2. Using the new accidents data frame that you created in (1), how many accidents are there in which 1 or more drunk drivers were involved in an accident with a school bus?
Hint: Look at the variables DRUNK_DR and SCH_BUS.
Relevant topics: pandas indexing, pandas shape attribute
Item(s) to submit:
- Python code used to solve the problem.
- Output from running your code.
3. Again using the accidents data frame: For accidents involving 1 or more drunk drivers and a school bus, how many happened in each of the 7 years? Which year had the largest number of these types of accidents?
Important note: Does the groupby method seem familiar to you? It should! It is extremely similar to tapply in R. Typically functions that behave like tapply are called something like "groupby" -- R is the oddball this time.
Relevant topics: pandas indexing, pandas idxmax, pandas groupby, pandas count, pandas reset_index
Item(s) to submit:
- Python code used to solve the problem.
- Output from running your code.
4. Again using the accidents data frame: Calculate the mean number of motorists involved in an accident (column PERSONS) with i drunk drivers (column DRUNK_DR), where i takes the values from 0 through 6.
Relevant topics: pandas groupby, pandas mean, pandas indexing
Item(s) to submit:
- Python code used to solve the problem.
- Output from running your code.
5. Break the day into portions, as follows: midnight to 6AM, 6AM to 12 noon, 12 noon to 6PM, 6PM to midnight, other. Find the total number of fatalities that occur during each of these time intervals. Also, find the average number of fatalities per crash that occurs during each of these time intervals.
Hint: You'll want to pay special attention to the include_lowest option of pandas.cut (similarly to R's cut).
Relevant topics: pandas cut, pandas groupby, pandas sum, pandas mean
Item(s) to submit:
- Python code used to solve the problem.
- Output from running your code.
Project 12
Motivation: We’d be remiss spending almost an entire semester solving data driven problems in python without covering the basics of classes. Whether or not you will ever choose to use this feature in your work, it is best to at least understand some of the basics so you can navigate libraries and other code that does use it.
Context: We’ve spent nearly the entire semester solving data driven problems in python, and now we are going to learn about one of the primary features in python: classes. Python is an object oriented programming language, and as such, much of python, and the libraries you use in python are objects which have properties and methods. In this project we will explore some of the terminology and syntax relating to classes.
Scope: python
Learning objectives:
- Explain the basics of object oriented programming, and what a class is.
- Use classes to solve a data-driven problem.
Make sure to read about, and use the template found here, and the important information about projects submissions here.
Dataset
In this project, and the next, we will learn about classes by simulating a simplified version of Blackjack! Don't worry, while this may sound intimidating, there is very little coding involved, and much of the code will be provided to you to use!
Questions
1. Create a Card class with a number and a suit. The number should be any number between 2-10 or any of a 'J', 'Q', 'K', or 'A' (for Jack, Queen, King, or Ace). The suit should be any of: "Clubs", "Hearts", "Spades", or "Diamonds". You should initialize a Card by first providing the number then the suit. Make sure that any provided number is one of our valid values, if it isn't, throw an exception (that is, stop the function and return a message):
Here are some examples to test:
my_card = Card(11, "Hearts") # Exception: Number wasn't 2-10 or J, Q, K, or A.
my_card = Card(10, "Stars") # Suit wasn't one of: clubs, hearts, spades, or diamonds.
my_card = Card("10", "Spades")
my_card = Card("2", "clubs")
my_card = Card("2", "club") # Suit wasn't one of: clubs, hearts, spades, or diamonds.
Hint: To raise an exception, you can do:
raise Exception("Suit wasn't one of: clubs, hearts, spades, or diamonds.")Hint: Here is some starter code to fill in:
class Card:
    _value_dict = {"2": 2, "3": 3, "4": 4, "5": 5, "6": 6, "7": 7, "8":8, "9":9, "10": 10, "j": 11, "q": 12, "k": 13, "a": 14}
    def __init__(self, number, suit):
        # if number is not a valid 2-10 or j, q, k, or a
        # raise Exception

        # else set the value for self.number to str(self.number)

        # if the suit.lower() isn't a valid suit: clubs hearts diamonds spades
        # raise Exception

        # else, set the value for self.suit to suit.lower()
Important note: Accept both upper and lowercase variants for both suit and number. To do this, convert any input to lowercase prior to processing/saving. For number, you can do str(num).lower().
Relevant topics: classes
Item(s) to submit:
- Python code used to solve the problem.
- Output from running your code.
Solution
class Card:
    _value_dict = {"2": 2, "3": 3, "4": 4, "5": 5, "6": 6, "7": 7, "8":8, "9":9, "10": 10, "j": 11, "q": 12, "k": 13, "a": 14}
    def __init__(self, number, suit):
        if str(number).lower() not in [str(num) for num in range(2, 11)] + list("jqka"):
            raise Exception("Number wasn't 2-10 or J, Q, K, or A.")
        else:
            self.number = str(number).lower()
        if suit.lower() not in ["clubs", "hearts", "diamonds", "spades"]:
            raise Exception("Suit wasn't one of: clubs, hearts, spades, or diamonds.")
        else:
            self.suit = suit.lower()
2. Usually when we talk about a particular card, we say it is a "Four of Spades" or "King of Hearts", etc. Right now, if you print(my_card) you will get something like <__main__.Card object at 0x7fccd0523208>. Not very useful. We have a dunder method for that!
Implement the __str__ dunder method to work like this:
print(Card("10", "Spades")) # 10 of spades
print(Card("2", "clubs")) # 2 of clubsImplement both dunder methods to function as exemplified.
Hint: This article has examples of both __str__ and __repr__.
Relevant topics: classes
Item(s) to submit:
- Python code used to solve the problem.
- Output from running your code.
Solution
class Card:
    _value_dict = {"2": 2, "3": 3, "4": 4, "5": 5, "6": 6, "7": 7, "8":8, "9":9, "10": 10, "j": 11, "q": 12, "k": 13, "a": 14}
    def __init__(self, number, suit):
        if str(number).lower() not in [str(num) for num in range(2, 11)] + list("jqka"):
            raise Exception("Number wasn't 2-10 or J, Q, K, or A.")
        else:
            self.number = str(number).lower()
        if suit.lower() not in ["clubs", "hearts", "diamonds", "spades"]:
            raise Exception("Suit wasn't one of: clubs, hearts, spades, or diamonds.")
        else:
            self.suit = suit.lower()

    def __str__(self):
        return(f'{self.number} of {self.suit.lower()}')

    def __repr__(self):
        return(f'Card(str({self.number}), "{self.suit}")')
3. It is natural that we should be able to compare cards, after all thats necessary to play nearly any game. Typically there are two ways to "sort" cards. Ace high, or ace low. Ace high is when the Ace represents the highest card.
Implement the following dunder methods to enable comparison of cards where ace is high:
__eq____lt____gt__
Make sure the following examples work:
card1 = Card(2, "spades")
card2 = Card(3, "hearts")
card3 = Card(3, "diamonds")
card4 = Card(3, "Hearts")
card5 = Card("A", "Spades")
card6 = Card("A", "Hearts")
card7 = Card("K", "Diamonds")

print(card1 < card2) # True
print(card1 < card3) # True
print(card2 == card3) # True
print(card2 == card4) # True
print(card3 < card4) # False
print(card4 < card3) # False
print(card5 > card4) # True
print(card5 > card6) # False
print(card5 == card6) # True
print(card7 < card5) # True
print(card7 > card1) # True
Important note: Two cards are deemed equal if they have the same number, regardless of their suits.
Hint: There are many ways to deal with comparing the "JKQA" against other numbers. One possibility is to have a dict that maps the value of the card to it's numeric value.
Hint: This example shows a short example of how to implement these dunder methods.
Relevant topics: classes
Item(s) to submit:
- Python code used to solve the problem.
- Output from running your code.
Solution
class Card:
    _value_dict = {"2": 2, "3": 3, "4": 4, "5": 5, "6": 6, "7": 7, "8":8, "9":9, "10": 10, "j": 11, "q": 12, "k": 13, "a": 14}
    def __init__(self, number, suit):
        if str(number).lower() not in [str(num) for num in range(2, 11)] + list("jqka"):
            raise Exception("Number wasn't 2-10 or J, Q, K, or A.")
        else:
            self.number = str(number).lower()
        if suit.lower() not in ["clubs", "hearts", "diamonds", "spades"]:
            raise Exception("Suit wasn't one of: clubs, hearts, spades, or diamonds.")
        else:
            self.suit = suit.lower()

    def __str__(self):
        return(f'{self.number} of {self.suit.lower()}')

    def __repr__(self):
        return(f'Card(str({self.number}), "{self.suit}")')

    def __eq__(self, other):
        if self.number == other.number:
            return True
        else:
            return False

    def __lt__(self, other):
        if self._value_dict[self.number] < self._value_dict[other.number]:
            return True
        else:
            return False

    def __gt__(self, other):
        if self._value_dict[self.number] > self._value_dict[other.number]:
            return True
        else:
            return False
4. We've provided you with the code below:
class Deck:
    _suits = ["clubs", "hearts", "diamonds", "spades"]
    _numbers = [str(num) for num in range(2, 11)] + list("jqka")

    def __init__(self):
        self.cards = [Card(number, suit) for suit in self._suits for number in self._numbers]
As you can see, we are working on building a Deck class. Use the code provided and create an instance of a new Deck called lucky_deck. Print the cards out to make sure it looks right. Make sure that the Deck has the correct number of cards, print the len of the Deck. What happens? Instead of trying to find the length, try to access and print a single card: print(lucky_deck[10]). What happens?
Relevant topics: classes
Item(s) to submit:
- Python code used to solve the problem.
- Output from running your code.
- 1-2 sentences explaining what happens when you try doing what we ask.
Solution
class Deck:
    _suits = ["clubs", "hearts", "diamonds", "spades"]
    _numbers = [str(num) for num in range(2, 11)] + list("jqka")

    def __init__(self):
        self.cards = [Card(number, suit) for suit in self._suits for number in self._numbers]

    # this would also be acceptable
    def __str__(self):
        return(f'{self.cards})
lucky_deck = Deck()
print(lucky_deck.cards)len(lucky_deck) # TypeError: object of type 'Deck' has no len()print(lucky_deck[10]) # TypeError: 'Deck' object is not subscriptable5. As it turns out, we can fix both of the issues we ran into in question (4). To fix the issue with len, implement the __len__ dunder method. Does it work now?
To fix the indexing issue, implement the __getitem__ dunder method. Test out (but don't forget to re-run to get an updated lucky_deck):
# make sure to re-create your Deck below this line


# these should both work now
len(lucky_deck) # 52
print(lucky_deck[10]) # q of clubs
Hint: This article has examples of both __len__ and __getitem__.
Relevant topics: classes
Item(s) to submit:
- Python code used to solve the problem.
- Output from running your code.
Solution
class Deck:
    _suits = ["clubs", "hearts", "diamonds", "spades"]
    _numbers = [str(num) for num in range(2, 11)] + list("jqka")

    def __init__(self):
        self.cards = [Card(number, suit) for suit in self._suits for number in self._numbers]

    def __len__(self):
        return len(self.cards)

    def __getitem__(self, key):
        return self.cards[key]
Project 13
Motivation: We’d be remiss spending almost an entire semester solving data driven problems in python without covering the basics of classes. Whether or not you will ever choose to use this feature in your work, it is best to at least understand some of the basics so you can navigate libraries and other code that does use it.
Context: We’ve spent nearly the entire semester solving data driven problems in python, and now we are going to learn about one of the primary features in python: classes. Python is an object oriented programming language, and as such, much of python, and the libraries you use in python are objects which have properties and methods. In this project we will explore some of the terminology and syntax relating to classes.
Scope: python
Learning objectives:
- Explain the basics of object oriented programming, and what a class is.
- Use classes to solve a data-driven problem.
Make sure to read about, and use the template found here, and the important information about projects submissions here.
Dataset
This is the continuation of the previous project. In this project we will learn about classes by simulating a simplified version of Blackjack! Don't worry, while this may sound intimidating, there is very little coding involved, and much of the code will be provided to you to use!
Questions
1. In the previous project, we built a Deck and Card class. What is one other very common task that people do with decks of cards? Shuffle! There is a function in Python called shuffle. It can be used like:
from random import shuffle

my_list = [1,2,3]
print(my_list)
## [1, 2, 3]shuffle(my_list)
print(my_list)## [3, 1, 2]Run the Deck and Card code from the previous project. Create a Deck and try to shuffle it. What happens?
To fix this, we can implement the __setitem__ dunder method. This dunder method allows us to "set" a value, much in the same way __getitem__ allows us to "get" a value. Re-run your Deck class and try to shuffle again and print out the first couple of cards to ensure it is truly shuffled.
Relevant topics: setitem example
Item(s) to submit:
- 1-2 sentences explaining what happens.
- Python code used to solve the problem.
- Output from running your code.
2. Let's take one last look at the Card class. In Blackjack, one thing you need to be able to do is count the value of the cards in your hand. Wouldn't it be convenient if we were able to add Cards together like the following?
print(Card("2", "clubs") + Card("k", "diamonds"))In order to do this, implement the __add__ dunder method, and test out the following.
print(Card("2", "clubs") + Card("k", "diamonds")) # 15
print(Card("k", "hearts") + Card("q", "hearts")) # 25
print(Card("k", "diamonds") + Card("a", "spades") + Card("5", "hearts")) # what happens with this last example
What happens with the last example? The reason this happens is that the first 2 cards are added together without any issue. Then, we add the final card and everything breaks down. Any guesses why? The reason is that the result of adding the first 2 cards is an integer, 27, and we try to then add \(27 + Card("5", "hearts")\) and Python doesn't know what to do! As usual, there is a dunder method for that.
Implement __radd__ and try again. __radd__ will look nearly identical to __add__, but where you previously added together the result of 2 dictionary lookups, we now just add the plain argument to 1 dictionary lookup.
Relevant topics: add, and radd example
Item(s) to submit:
- Python code used to solve the problem.
- Output from running your code.
3. Okay, rather than force you to stumble through writing a bunch of new code, we are going to provide you with a good amount of code, and have you read through it and digest it. We've provided:
- A
Cardclass with an updated__eq__method, and updated card values to fit blackjack. Make sure to add your__add__and__radd__methods to the providedCardclass. They are necessary to make everything work. - An updated
Deckclass with adrawmethod that allows the user to draw a card from the deck and keep track of how many cards are drawn. Make sure to add your__setitem__and__getitem__methods to the providedDeckclass. - A
Handclass that represents a "hand" of cards. - A
Playerclass that represents a player. - A
BlackJackclass that represents a single game of Blackjack.
Card
Make sure to add your __add__ and __radd__ methods to the provided Card class. They are necessary to make everything work.
Methods from the previous project will be added below Saturday morning, or at the latest Monday morning.
class Card:
    _value_dict = {"2": 2, "3": 3, "4": 4, "5": 5, "6": 6, "7": 7, "8":8, "9":9, "10": 10, "j": 10, "q": 10, "k": 10, "a": 11}
    def __init__(self, number, suit):
        if str(number).lower() not in [str(num) for num in range(2, 11)] + list("jqka"):
            raise Exception("Number wasn't 2-10 or J, Q, K, or A.")
        else:
            self.number = str(number).lower()
        if suit.lower() not in ["clubs", "hearts", "diamonds", "spades"]:
            raise Exception("Suit wasn't one of: clubs, hearts, spades, or diamonds.")
        else:
            self.suit = suit.lower()

    def __str__(self):
        return(f'{self.number} of {self.suit.lower()}')

    def __repr__(self):
        return(f'Card(str({self.number}), "{self.suit}")')

    def __eq__(self, other):
        if isinstance(other, type(self)):
            if self.number == other.number:
                return True
            else:
                return False
        else:
            if self.number == other:
                return True
            else:
                return False

    def __lt__(self, other):
        if self._value_dict[self.number] < self._value_dict[other.number]:
            return True
        else:
            return False

    def __gt__(self, other):
        if self._value_dict[self.number] > self._value_dict[other.number]:
            return True
        else:
            return False
Deck
Make sure to add your __setitem__ and __getitem__ methods to the provided Deck class.
Methods from the previous project will be added below Saturday morning, or at the latest Monday morning.
class Deck:
    _suits = ["clubs", "hearts", "diamonds", "spades"]
    _numbers = [str(num) for num in range(2, 11)] + list("jqka")

    def __init__(self):
        self.cards = [Card(number, suit) for suit in self._suits for number in self._numbers]
        self._drawn = 0

    def __str__(self):
        return str(self.cards)

    def __len__(self):
        return len(self.cards) - self._drawn

    def draw(self, number_cards = 1):
        try:
            drawn_cards = self.cards[self._drawn:(self._drawn+number_cards)]
        except:
            print(f"Can't draw anymore cards, deck empty.")

        self._drawn += number_cards
        return drawn_cards
Hand
import queue
class Hand:
    def __init__(self, *cards):
        self.cards = [card for card in cards]

    def __str__(self):
        vals = [str(val) for val in self.cards]
        return(', '.join(vals))

    def __repr__(self):
        vals = [repr(val) for val in self.cards]
        return(', '.join(vals))

    def __len__(self):
        return len(self.cards)

    def __getitem__(self, key):
        return self.cards[key]

    def __setitem__(self, key, value):
        self.cards[key] = value

    def sum(self):
        # remember, when we compare to Ace of Hearts, we are really only comparing the values,
        # and ignoring the suit.
        number_aces = sum(1 for card in self.cards if card == Card("a", "hearts"))
        non_ace_sum = sum(card for card in self.cards if card != Card("a", "hearts"))

        if number_aces == 0:
            return non_ace_sum

        else:
            # only 2 options 1 ace is 11 the rest 1 or all 1
            high_option = non_ace_sum + number_aces*1 + 10
            low_option = non_ace_sum + number_aces*1

            if high_option <= 21:
                return high_option
            else:
                return low_option

    def add(self, *cards):
        self.cards = self.cards + list(cards)
        return self

    def clear(self):
        self.cards = []
Player
class Player:
    def __init__(self, name, strategy = None, dealer = False):
        self.name = name
        self.hand = Hand()
        self.dealer = dealer
        self.wins = 0
        self.draws = 0
        self.losses = 0
        if not self.dealer and not strategy:
            print(f"Non-dealer MUST have strategy.")

        self.strategy = strategy


    def __str__(self):
        summary = f'''{self.name}
------------
Wins: {self.wins/(self.wins+self.losses+self.draws):.2%}
Losses: {self.losses/(self.wins+self.losses+self.draws):.2%}
Draws: {self.draws/(self.wins+self.losses+self.draws):.2%}'''
        return summary

    def cards(self):
        if self.dealer:
            return [list(self.hand.cards)[0], "Face down"]
        else:
            return self.hand
BlackJack
import sys

class BlackJack:
    def __init__(self, *players, dealer = None):
        self.players = players
        self.deck = Deck()
        self.dealt = False
        if not dealer:
            self.dealer = Player('dealer', dealer=True)

    def deal(self):
        # shuffle the deck
        shuffle(self.deck)

        # we are ignoring dealing order and dealing to the dealer
        # first
        for _ in range(2):
            self.dealer.hand.add(*self.deck.draw())

        # deal 2 cards to each player
        for player in self.players:

            # first, clear out the players hands in case they've played already
            player.hand.clear()
            for _ in range(2):
                player.hand.add(*self.deck.draw())

        self.dealt = True

    def play(self):

        # make sure we've dealt
        if not self.dealt:
            sys.exit("You MUST deal the cards before playing.")

        # if dealer has face up ace or 10, checks to make sure
        # doesn't have blackjack.
        # remember, when we compare to Ace of Hearts, we are really only comparing the values,
        # and ignoring the suit.
        face_value_ten = (Card("10", "hearts"), Card("j", "hearts"), Card("q", "hearts"), Card("k", "hearts"), Card("a", "hearts"))
        if self.dealer.cards()[0] in face_value_ten:

            if self.dealer.hand.sum() == 21:
                # winners get a draw, losers
                # get a loss
                for player in self.players:
                    if player.hand.sum() == 21:
                        player.draws += 1

                    else:
                        player.losses += 1

                return "GAME OVER"


        # if the dealer doesn't win with a blackjack,
        # the players now know the dealer doesn't
        # have a blackjack


        # if the dealer doesn't have blackjack
        for player in self.players:
            # players play using their strategy until they hold
            while True:
                player_move = player.strategy(self, player)

                if player_move == "hit":
                    player.hand.add(*self.deck.draw())
                else:
                    break

        # dealer draws until >= 17
        while self.dealer.hand.sum() < 17:
            self.dealer.hand.add(*self.deck.draw())

        # if the dealer gets 21, players who get 21 draw
        # other lose
        if self.dealer.hand.sum() == 21:
            for player in self.players:
                if player.hand.sum() == 21:
                    player.draws += 1

                else:
                    player.losses += 1

        # otherwise, dealer has < 21, anyone with more wins, same draws,
        # and less loses
        elif self.dealer.hand.sum() < 21:
            for player in self.players:

                if player.hand.sum() > 21:
                    # player busts
                    player.losses += 1

                elif player.hand.sum() > self.dealer.hand.sum():
                    # player wins
                    player.wins += 1

                elif player.hand.sum() == self.dealer.hand.sum():
                    # player ties
                    player.draws += 1

                else:
                    # player loses
                    player.losses += 1

        # if dealer busts, players who didn't bust, win
        # players who busted, lose -- this is the house's edge
        else:
            for player in self.players:

                if player.hand.sum() < 21:
                    # player won
                    player.wins += 1

                else:
                    # player busted
                    player.losses += 1

        return "GAME OVER"
Read and understand the Hand class. Create a hand containing the: Ace of Diamonds, King of Hearts, Ace of Spades. Print the sum of the Hand. Add the 8 of Hearts to your Hand, and print the new sum. Do things appear to be working okay?
Relevant topics: classes
Item(s) to submit:
- Python code used to solve the problem.
- Output from running your code.
4. If you take a look at the Player class and inside of the BlackJack class, you may notice something we refer to as a "strategy". We define a strategy as any function that accepts a BlackJack object, and a Player object, and returns either a str "hit" or a str "hold". Here are a couple examples of "strategies":
def always_hit_once(my_blackjack_game, me) -> str:
    """
    This is a simple strategy where the player
    always hits once.
    """
    if len(me.hand) == 3:
        return "hold"
    else:
        return "hit"
def seventeen_plus(my_blackjack_game, me) -> str:
"""
This is a simple strategy where the player holds if the sum
of cards is 17+, and hits otherwise.
"""
if me.hand.sum() >= 17:
return "hold"
else:
return "hit"When you create a Player object, you provide a strategy as an argument, and that player uses the strategy inside of a BlackJack game.
Create 2 or more Players, using any of the provided strategies. Create 1000 or more BlackJack games with those players, and play the games. Print the results for each player.
Relevant topics: classes
Item(s) to submit:
- Python code used to solve the problem.
- Output from running your code.
5. Create your own strategy, make new games, and see how your strategy compares to the other provided strategies. Optionally, create a plot that illustrates the differences in the strategy.
Relevant topics: classes
Item(s) to submit:
- Python code used to solve the problem.
- Output from running your code.
- (Optionally, 0 pts) The plot described.
Project 14
Motivation: We covered a lot this year! When dealing with data driven projects, it is useful to explore the data, and answer different questions to get a feel for it. There are always different ways one can go about this. Proper preparation prevents poor performance, in this project we are going to practice using some of the skills you've learned, and review topics and languages in a generic way.
Context: We are on the last project where we will leave it up to you on how to solve the problems presented.
Scope: python, r, bash, unix, computers
Make sure to read about, and use the template found here, and the important information about projects submissions here.
Dataset
The following questions will use the dataset found in Scholar:
/class/datamine/data/disney/class/datamine/data/movies_and_tv/imdb.db/class/datamine/data/amazon/music.txt/class/datamine/data/craigslist/vehicles.csv/class/datamine/data/flights/2008.csv
Questions
Important: Answer the questions below using the language of your choice (R, Python, bash, awk, etc.). Don't feel limited by one language, you can use different languages to answer different questions. If you are feeling bold, you can also try answering the questions using all languages!
1. What percentage of flights in 2008 had a delay due to the weather? Use the /class/datamine/data/flights/2008.csv dataset to answer this question.
Hint: Consider a flight to have a weather delay if WEATHER_DELAY is greater than 0.
Item(s) to submit:
- The code used to solve the question.
- The answer to the question.
2. Which listed manufacturer has the most expensive previously owned car listed in Craiglist? Use the /class/datamine/data/craigslist/vehicles.csv dataset to answer this question. Only consider listings that have listed price less than $500,000 and where manufacturer information is available.
Item(s) to submit:
- The code used to solve the question.
- The answer to the question.
3. What is the most common and least common type of title in imdb ratings? Use the /class/datamine/data/movies_and_tv/imdb.db dataset to answer this question.
Hint: Use the titles table.
Hint: Don't know how to use SQL yet? To get this data into an R data.frame , for example:
library(tidyverse)

con <- DBI::dbConnect(RSQLite::SQLite(), ":memory:")
myDF <- tbl(con, "titles")
Item(s) to submit:
- The code used to solve the question.
- The answer to the question.
4. What percentage of music reviews contain the words hate or hated, and what percentage contain the words love or loved? Use the /class/datamine/data/amazon/music.txt dataset to answer this question.
Hint: It may take a minute to run, depending on the tool you use.
Item(s) to submit:
- The code used to solve the question.
- The answer to the question.
5. What is the best time to visit Disney? Use the data provided in /class/datamine/data/disney to answer the question.
First, you will need determine what you will consider "time", and the criteria you will use. See below some examples. Don't feel limited by them! Be sure to explain your criteria, use the data to investigate, and determine the best time to visit! Write 1-2 sentences commenting on your findings.
- As Splash Mountain is my favorite ride, my criteria is the smallest monthly average wait times for Splash Mountain between the years 2017 and 2019. I'm only considering these years as I expect them to be more representative. My definition of "best time" will be the "best months".
- Consider "best times" the days of the week that have the smallest wait time on average for all rides, or for certain favorite rides.
- Consider "best times" the season of the year where the park is open for longer hours.
- Consider "best times" the weeks of the year with smallest average high temperature in the day.
Item(s) to submit:
- The code used to solve the question.
- 1-2 sentences detailing the criteria you are going to use, its logic, and your defition for "best time".
- The answer to the question.
- 1-2 sentences commenting on your answer.
6. Finally, use RMarkdown (and its formatting) to outline 3 things you learned this semester from The Data Mine. For each thing you learned, give a mini demonstration where you highlight with text and code the thing you learned, and why you think it is useful. If you did not learn anything this semester from The Data Mine, write about 3 things you want to learn. Provide examples that demonstrate what you want to learn and write about why it would be useful.
Important: Make sure your answer to this question is formatted well and makes use of RMarkdown.
Item(s) to submit:
- 3 clearly labeled things you learned.
- 3 mini-demonstrations where you highlight with text and code the thin you learned, and why you think it is useful.
OR
- 3 clearly labeled things you want to learn.
- 3 examples demonstrating what you want to learn, with accompanying text explaining why you think it would be useful.
STAT 29000
Topics
The following table roughly highlights the topics and projects for the semester. This is slightly adjusted throughout the semester as student performance and feedback is taken into consideration.
| Language | Project # | Name | Topics |
|---|---|---|---|
| Python | 1 | Web scraping: part I | xml, lxml, pandas, etc. |
| Python | 2 | Web scraping: part II | requests, functions, xml, loops, if statements, etc. |
| Python | 3 | Web scraping: part III | selenium, lxml, lists, pandas, etc. |
| Python | 4 | Web scraping: part IV | requests, beautifulsoup4, lxml, selenium, xml, cronjobs, loops, etc. |
| Python | 5 | Web scraping: part V | web scraping + related topics |
| Python | 6 | Plotting in Python: part I | ways to plot in Python, more work with pandas, etc. |
| Python | 7 | Plotting in Python: part II | ways to plot in Python, more work with pandas, etc. |
| Python | 8 | Writing scripts: part I | how to write scripts in Python, more work with pandas, matplotlib, etc. |
| Python | 9 | Writing scripts: part II | how to write scripts in Python, argparse, more work with pandas, matplotlib, etc. |
| R | 10 | ggplot: part I | ggplot basics |
| R | 11 | ggplot: part II | more ggplot |
| R | 12 | tidyverse & data.table: part I | data wrangling and computation using tidyverse packages and data.table |
| R | 13 | tidyverse & data.table: part II | data wrangling and computation using tidyverse packages and data.table |
| R | 14 | tidyverse & data.table: part III | data wrangling and computation using tidyverse packages and data.table |
Project 1
Motivation: Extensible Markup Language or XML is a very important file format for storing structured data. Even though formats like JSON, and csv tend to be more prevalent, many, many legacy systems still use XML, and it remains an appropriate format for storing complex data. In fact, JSON and csv are quickly becoming less relevant as new formats and serialization methods like parquet and protobufs are becoming more common.
Context: In previous semesters we've explored XML. In this project we will refresh our skills and, rather than exploring XML in R, we will use the lxml package in Python. This is the first project in a series of 5 projects focused on web scraping in R and Python.
Scope: python, XML
Learning objectives:
- Review and summarize the differences between XML and HTML/CSV.
- Match XML terms to sections of XML demonstrating working knowledge.
Make sure to read about, and use the template found here, and the important information about projects submissions here.
Dataset
The following questions will use the dataset found in Scholar:
/class/datamine/data/apple/health/watch_dump.xml
Resources
We realize that for many of you this is a big "jump" right into Python. Don't worry! Python is a very intuitive language with a clean syntax. It is easy to read and write. We will do our very best to keep things as straightforward as possible, especially in the early learning stages of the class.
We will be actively updating the examples book with videos and more examples throughout the semester. Ask a question in Piazza and perhaps we will add an example straight to the book to help out.
Some potentially useful resources for the semester include:
- The STAT 19000 projects. We are easing 19000 students into Python and will post solutions each week. It would be well worth 10 minutes to look over the questions and solutions each week.
- Here is a decent cheat sheet that helps you quickly get an idea of how to do something you know how to do in R, in Python.
- The Examples Book -- updating daily with more examples and videos. Be sure to click on the "relevant topics" links as we try to point you to topics with examples that should be particularly useful to solve the problems we assign.
Questions
Important note: It would be well worth your time to read through the xml section of the book, as well as take the time to work through pandas 10 minute intro.
1. A good first step when working with XML is to get an idea how your document is structured. Normally, there should be good documentation that spells this out for you, but it is good to know what to do when you don't have the documentation. Start by finding the "root" node. What is the name of the root node of the provided dataset?
Hint: Make sure to import the lxml package first:
from lxml import etreeHere are two videos about running Python in RStudio:
and here is a video about XML scraping in Python:
Item(s) to submit:
- Python code used to solve the problem.
- Output from running your code.
Solution
from lxml import etree

tree = etree.parse("/class/datamine/data/apple/health/watch_dump.xml")

tree.xpath("/*")[0].tag
2. Remember, XML can be nested. In question (1) we figured out what the root node was called. What are the names of the next "tier" of elements?
Hint: Now that we know the root node, you could use the root node name as a part of your xpath expression.
Hint: As you may have noticed in question (1) the xpath method returns a list. Sometimes this list can contain many repeated tag names. Since our goal is to see the names of the second "tier" elements, you could convert the resulting list to a set to quickly see the unique list as set's only contain unique values.
Relevant topics: for loops, lxml, xml
Item(s) to submit:
- Python code used to solve the problem.
- Output from running your code.
Solution
set([x.tag for x in tree.xpath("/HealthData/*")])Solution
print(set([x.tag for x in tree.xpath("/HealthData/*")]))

print(set([x.tag for x in tree.xpath("/HealthData/ActivitySummary/*")]))
print(set([x.tag for x in tree.xpath("/HealthData/Record/*")]))
print(set([x.tag for x in tree.xpath("/HealthData/Workout/*")]))

print(set([x.tag for x in tree.xpath("/HealthData/Record/HeartRateVariabilityMetadataList/*")]))
print(set([x.tag for x in tree.xpath("/HealthData/Record/MetadataEntry/*")]))
print(set([x.tag for x in tree.xpath("/HealthData/Workout/WorkoutEvent/*")]))
print(set([x.tag for x in tree.xpath("/HealthData/Workout/WorkoutRoute/*")]))
print(set([x.tag for x in tree.xpath("/HealthData/Workout/WorkoutEntry/*")]))

print(set([x.tag for x in tree.xpath("/HealthData/Record/HeartRateVariabilityMetadataList/InstantaneousBeatsPerMinute/*")]))
print(set([x.tag for x in tree.xpath("/HealthData/Workout/WorkoutRoute/FileReference/*")]))
print(set([x.tag for x in tree.xpath("/HealthData/Workout/WorkoutRoute/MetadataEntry/*")]))
/HealthData/Record/HeartRateVariabilityMetadataList/InstantaneousBeatsPerMinute /HealthData/Workout/WorkoutRoute/FileReference /HealthData/Workout/WorkoutRoute/MetadataEntry /HealthData/Record/MetadataEntry /HealthData/Workout/WorkoutEvent /HealthData/Workout/WorkoutEntry /HealthData/ActivitySummary
Or, it could be in an attribute:
<question answer="tac">What is cat spelled backwards?</question>Collect the "ActivitySummary" data, and convert the list of dicts to a pandas DataFrame. The following is an example of converting a list of dicts to a pandas DataFrame called myDF:
import pandas as pd

list_of_dicts = []
list_of_dicts.append({'columnA': 1, 'columnB': 2})
list_of_dicts.append({'columnB': 4, 'columnA': 1})

myDF = pd.DataFrame(list_of_dicts)
Hint: It is important to note that an element's "attrib" attribute looks and feels like a dict, but it is actually a lxml.etree._Attrib. If you try to convert a list of lxml.etree._Attrib to a pandas DataFrame, it will not work out as you planned. Make sure to first convert each lxml.etree._Attrib to a dict before converting to a DataFrame. You can do so like:
# this will convert a single `lxml.etree._Attrib` to a dict
my_dict = dict(my_lxml_etree_attrib)
Relevant topics: dicts, lists, lxml, xml, for loops
Item(s) to submit:
- Python code used to solve the problem.
- Output from running your code.
Solution
dat = tree.xpath("/HealthData/ActivitySummary")
list_of_dicts = []

for e in dat:
    list_of_dicts.append(dict(e.attrib))

myDF = pd.DataFrame(data=list_of_dicts)
myDF.sort_values(['activeEnergyBurned'], ascending=False).head()
5. pandas is a Python package that provides the DataFrame and Series classes. A DataFrame is very similar to a data.frame in R and can be used to manipulate the data within very easily. A Series is the class that handles a single column of a DataFrame. Go through the pandas in 10 minutes page from the official documentation. Sort, find, and print the top 5 rows of data based on the "activeEnergyBurned" column.
Relevant topics: pandas, dicts, lists, lxml, xml, for loops
Item(s) to submit:
- Python code used to solve the problem.
- Output from running your code.
Solution
# could be anythingProject 2
Motivation: Web scraping is is the process of taking content off of the internet. Typically this goes hand-in-hand with parsing or processing the data. Depending on the task at hand, web scraping can be incredibly simple. With that being said, it can quickly become difficult. Typically, students find web scraping fun and empowering.
Context: In the previous project we gently introduced XML and xpath expressions. In this project, we will learn about web scraping, scrape data from The New York Times, and parse through our newly scraped data using xpath expressions.
Scope: python, web scraping, xml
Learning objectives: html
- Review and summarize the differences between XML and HTML/CSV.
- Use the requests package to scrape a web page.
- Use the lxml package to filter and parse data from a scraped web page.
Make sure to read about, and use the template found here, and the important information about projects submissions here.
Dataset
You will be extracting your own data from online in this project. There is no base dataset.
Questions
By the end of this project you will be able to scrape some data from this website! The first step is to explore the structure of the website. You can either right click and click on "view page source", which will pull up a page full of HTML used to render the page. Alternatively, if you want to focus on a single element, an article title, for example, right click on the article title and click on "inspect element". This will pull up an inspector that allows you to see portions of the HTML.
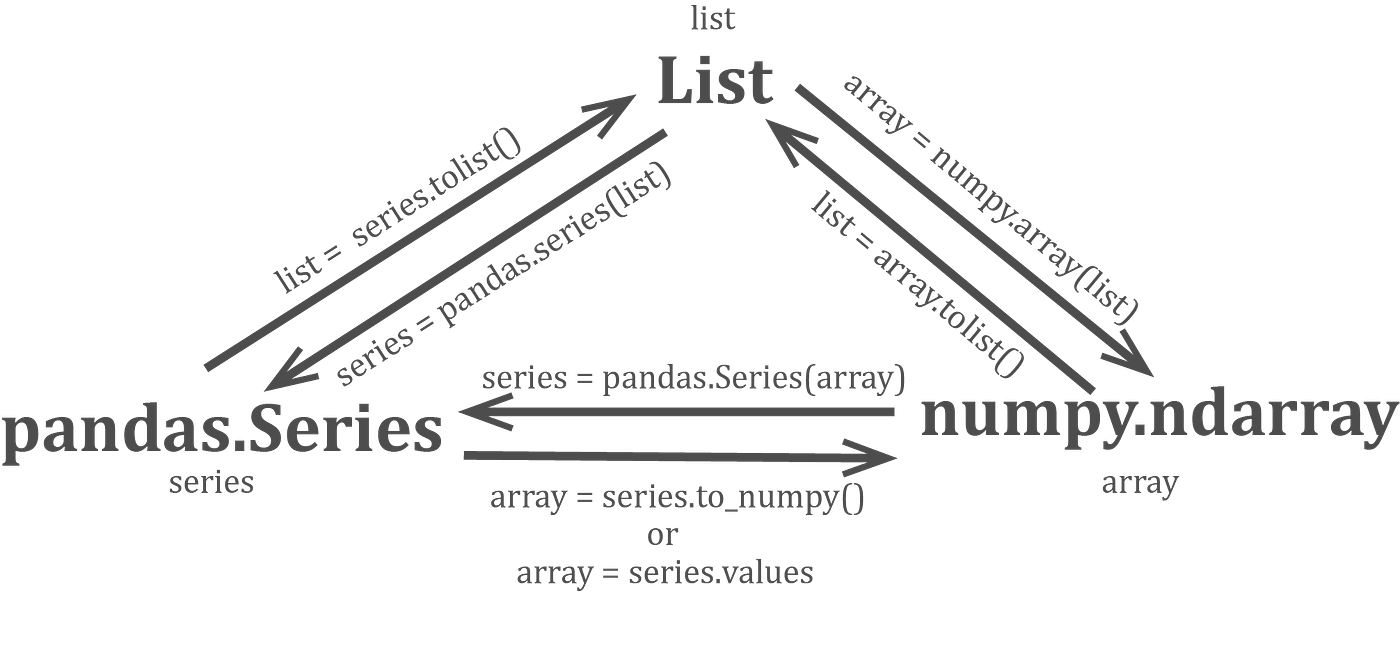
Copy and paste the h1 element (in its entirety) containing the article title (for the article provided) in an HTML code chunk. Do the same for the same article's summary.
Relevant topics: html
Item(s) to submit:
- 2 code chunks containing the HTML requested.
Solution
<h1 id="link-4686dc8b" class="css-rsa88z e1h9rw200" data-test-id="headline">U.S. Says China’s Repression of Uighurs Is ‘Genocide’</h1><p id="article-summary" class="css-w6ymp8 e1wiw3jv0">The finding by the Trump administration is the strongest denunciation by any government of China’s actions and follows a Biden campaign statement with the same declaration.</p>2. In question (1) we copied two elements of an article. When scraping data from a website, it is important to continually consider the patterns in the structure. Specifically, it is important to consider whether or not the defining characteristics you use to parse the scraped data will continue to be in the same format for new data. What do I mean by defining characterstic? I mean some combination of tag, attribute, and content from which you can isolate the data of interest.
For example, given a link to a new nytimes article, do you think you could isolate the article title by using the id="link-4686dc8b" attribute of the h1 tag? Maybe, or maybe not, but it sure seems like "link-4686dc8b" might be unique to the article and not able to be used given a new article.
Write an xpath expression to isolate the article title, and another xpath expression to isolate the article summary.
Important note: You do not need to test your xpath expression yet, we will be doing that shortly.
Relevant topics: html, xml, xpath expressions
Item(s) to submit:
- Two xpath expressions in an HTML code chunk.
Solution
//h1[@data-test-id="headline"]//p[@id="article-summary"]3. Use the requests package to scrape the webpage containing our article from questions (1) and (2). Use the lxml.html package and the xpath method to test out your xpath expressions from question (2). Did they work? Print the content of the elements to confirm.
Relevant topics: html, xml, xpath expressions, lxml
Item(s) to submit:
- Python code used to solve the problem.
- Output from running your code.
Solution
import lxml.html
import requests

url =  "https://www.nytimes.com/2021/01/19/us/politics/trump-china-xinjiang.html"
response = requests.get(url, stream=True)
response.raw.decode_content = True
tree = lxml.html.parse(response.raw)

print(tree.xpath('//p[@id="article-summary"]')[0].text)
print(tree.xpath('//h1[@data-test-id="headline"]')[0].text)
4. Here are a list of article links from https://nytimes.com:
https://www.nytimes.com/2021/01/19/us/politics/trump-china-xinjiang.html
https://www.nytimes.com/2021/01/13/movies/letterboxd-growth.html
Write a function called get_article_and_summary that accepts a string called link as an argument, and returns both the article title and summary. Test get_article_and_summary out on each of the provided links:
title, summary = get_article_and_summary('https://www.nytimes.com/2021/01/19/us/politics/trump-china-xinjiang.html')
print(f'Title: {title}, Summary: {summary}')
title, summary = get_article_and_summary('https://www.nytimes.com/2021/01/06/technology/personaltech/tech-2021-augmented-reality-chatbots-wifi.html')
print(f'Title: {title}, Summary: {summary}')
title, summary = get_article_and_summary('https://www.nytimes.com/2021/01/13/movies/letterboxd-growth.html')
print(f'Title: {title}, Summary: {summary}')
Hint: The first line of your function should look like this:
def get_article_and_summary(myURL: str) -> (str, str):
Relevant topics: html, xml, xpath expressions, lxml, functions
Item(s) to submit:
- Python code used to solve the problem.
- Output from running your code.
Solution
from typing import Tuple
import lxml.html
import requests

def get_article_and_summary(link: str) -> Tuple[str, str]:
    """
    Given a link to a new york times article, return the article title and summary.

    Args:
        link (str): The link to the new york times article.

    Returns:
        Tuple[str, str]: A tuple first containing the article title, and then the article summary.
    """

    # scrape the web page
    response = requests.get(link, stream=True)
    response.raw.decode_content = True
    tree = lxml.html.parse(response.raw)

    title = tree.xpath('//p[@id="article-summary"]')[0].text
    summary = tree.xpath('//h1[@data-test-id="headline"]')[0].text

    return title, summary
title, summary = get_article_and_summary('https://www.nytimes.com/2021/01/19/us/politics/trump-china-xinjiang.html')
print(f'Title: {title}, Summary: {summary}')
title, summary = get_article_and_summary('https://www.nytimes.com/2021/01/06/technology/personaltech/tech-2021-augmented-reality-chatbots-wifi.html')
print(f'Title: {title}, Summary: {summary}')
title, summary = get_article_and_summary('https://www.nytimes.com/2021/01/13/movies/letterboxd-growth.html')
print(f'Title: {title}, Summary: {summary}')5. In question (1) we mentioned a myriad of other important information given at the top of most New York Times articles. Choose one other listed pieces of information and copy, paste, and update your solution to question (4) to scrape and return those chosen pieces of information.
Important note: If you choose to scrape non-textual data, be sure to return data of an appropriate type. For example, if you choose to scrape one of the images, either print the image or return a PIL object.
Relevant topics: html, xml, xpath expressions, lxml, functions
Item(s) to submit:
- Python code used to solve the problem.
- Output from running your code.
Solution
from typing import Tuple
import lxml.html
import requests
import io
from PIL import Image
from IPython.display import display
def get_article_and_summary(link: str) -> Tuple[str, str]:
"""
Given a link to a new york times article, return the article title and summary.
Args:
link (str): The link to the new york times article.
Returns:
Tuple[str, str]: A tuple first containing the article title, and then the article summary.
"""
# scrape the web page
response = requests.get(link, stream=True)
response.raw.decode_content = True
tree = lxml.html.parse(response.raw)
# parse out the title
title = tree.xpath('//p[@id="article-summary"]')[0].text
# parse out the summary
summary = tree.xpath('//h1[@data-test-id="headline"]')[0].text
# parse out the url to the image
photo_src = tree.xpath('//picture/img')[0].attrib.get("src")
# scrape image
photo_content = requests.get(photo_src).content
# convert image format
photo_file = io.BytesIO(photo_content)
photo = Image.open(photo_file).convert('RGB')
# parse out photo caption
caption = tree.xpath('//figcaption/span')[0].text
# parse out the photo credits
credits = tree.xpath('//figcaption/span/span[contains(text(), "Credit")]/following-sibling::span/span')
credits_list = []
for c in credits:
credits_list.append(c.text)
# parse author photo url
# only gets if "author" in photo src attribute
photo_src_elements = tree.xpath('//img[contains(@src, "author")]')
# if "author" in photo src attribute
photo_srcs = []
for p in photo_src_elements:
photo_srcs.append(p.attrib.get("src"))
# scrape image
author_images = []
for img in photo_srcs:
photo_content = requests.get(img).content
# convert image format
photo_file = io.BytesIO(photo_content)
photo = Image.open(photo_file).convert('RGB')
author_images.append(photo)
# parse out authors
authors_elements = tree.xpath("//span[@class='byline-prefix']/following-sibling::a/span")
authors = []
for a in authors_elements:
authors.append(a.text)
# parse out article publish date/time
dt = tree.xpath("//time")[0].attrib.get("datetime")
return title, summary, photo, caption, credits, author_images, authors, dt
title, summary, photo, caption, credits, author_images, authors, dt = get_article_and_summary('https://www.nytimes.com/2021/01/19/us/politics/trump-china-xinjiang.html')
print(f'Title:\n{title}, Summary:\n{summary}, Caption:\n{caption}')
title, summary, photo, caption, credits, author_images, authors, dt = get_article_and_summary('https://www.nytimes.com/2021/01/06/technology/personaltech/tech-2021-augmented-reality-chatbots-wifi.html')
print(f'Title:\n{title}, Summary:\n{summary}, Caption:\n{caption}')
title, summary, photo, caption, credits, author_images, authors, dt = get_article_and_summary('https://www.nytimes.com/2021/01/13/movies/letterboxd-growth.html')
print(f'Title:\n{title}, Summary:\n{summary}, Caption:\n{caption}')Project 3
Motivation: Web scraping takes practice, and it is important to work through a variety of common tasks in order to know how to handle those tasks when you next run into them. In this project, we will use a variety of scraping tools in order to scrape data from https://trulia.com.
Context: In the previous project, we got our first taste at actually scraping data from a website, and using a parser to extract the information we were interested in. In this project, we will introduce some tasks that will require you to use a tool that let's you interact with a browser, selenium.
Scope: python, web scraping, selenium
Learning objectives:
- Review and summarize the differences between XML and HTML/CSV.
- Use the requests package to scrape a web page.
- Use the lxml package to filter and parse data from a scraped web page.
- Use selenium to interact with a browser in order to get a web page to a desired state for scraping.
Make sure to read about, and use the template found here, and the important information about projects submissions here.
Questions
1. Visit https://trulia.com. Many websites have a similar interface, i.e. a bold and centered search bar for a user to interact with. Using selenium write Python code that that first finds the input element, and then types "West Lafayette, IN" followed by an emulated "Enter/Return". Confirm you code works by printing the url after that process completes.
Hint: You will want to use time.sleep to pause a bit after the search so the updated url is returned.
That video is already relevant for Question 2 too.
Relevant topics: selenium, xml
Item(s) to submit:
- Python code used to solve the problem.
- Output from running your code.
Solution
from selenium import webdriver
from selenium.webdriver.common.keys import Keys
from selenium.webdriver.firefox.options import Options
from selenium.common.exceptions import NoSuchElementException
import timefirefox_options = Options()
firefox_options.add_argument("window-size=1920,1080")
firefox_options.add_argument("--headless") # Headless mode means no GUI
firefox_options.add_argument("start-maximized")
firefox_options.add_argument("disable-infobars")
firefox_options.add_argument("--disable-extensions")
firefox_options.add_argument("--no-sandbox")
firefox_options.add_argument("--disable-dev-shm-usage")
firefox_options.binary_location = '/class/datamine/apps/firefox/firefox'driver = webdriver.Firefox(options=firefox_options, executable_path='/class/datamine/apps/geckodriver')
url = 'https://www.trulia.com'
driver.get(url)
search_input = driver.find_element_by_id("banner-search")
search_input.send_keys("West Lafayette, IN")
search_input.send_keys(Keys.RETURN)
time.sleep(3)
print(driver.current_url)2. Use your code from question (1) to test out the following queries:
- West Lafayette, IN (City, State)
- 47906 (Zip)
- 4505 Kahala Ave, Honolulu, HI 96816 (Full address)
If you look closely you will see that there are patterns in the url. For example, the following link would probably bring up homes in Crawfordsville, IN: https://trulia.com/IN/Crawfordsville. With that being said, if you only had a zip code, like 47933, it wouldn't be easy to guess https://www.trulia.com/IN/Crawfordsville/47933/, hence, one reason why the search bar is useful.
If you used xpath expressions to complete question (1), instead use a different method to find the input element. If you used a different method, use xpath expressions to complete question (1).
Relevant topics: selenium, xml
Item(s) to submit:
- Python code used to solve the problem.
- Output from running your code.
Solution
driver = webdriver.Firefox(options=firefox_options, executable_path='/class/datamine/apps/geckodriver')
url = 'https://www.trulia.com'
driver.get(url)
search_input = driver.find_element_by_xpath("//input[@id='banner-search']")
search_input.send_keys("West Lafayette, IN")
search_input.send_keys(Keys.RETURN)
time.sleep(3)
print(driver.current_url)3. Let's call the page after a city/state or zipcode search a "sales page". For example:
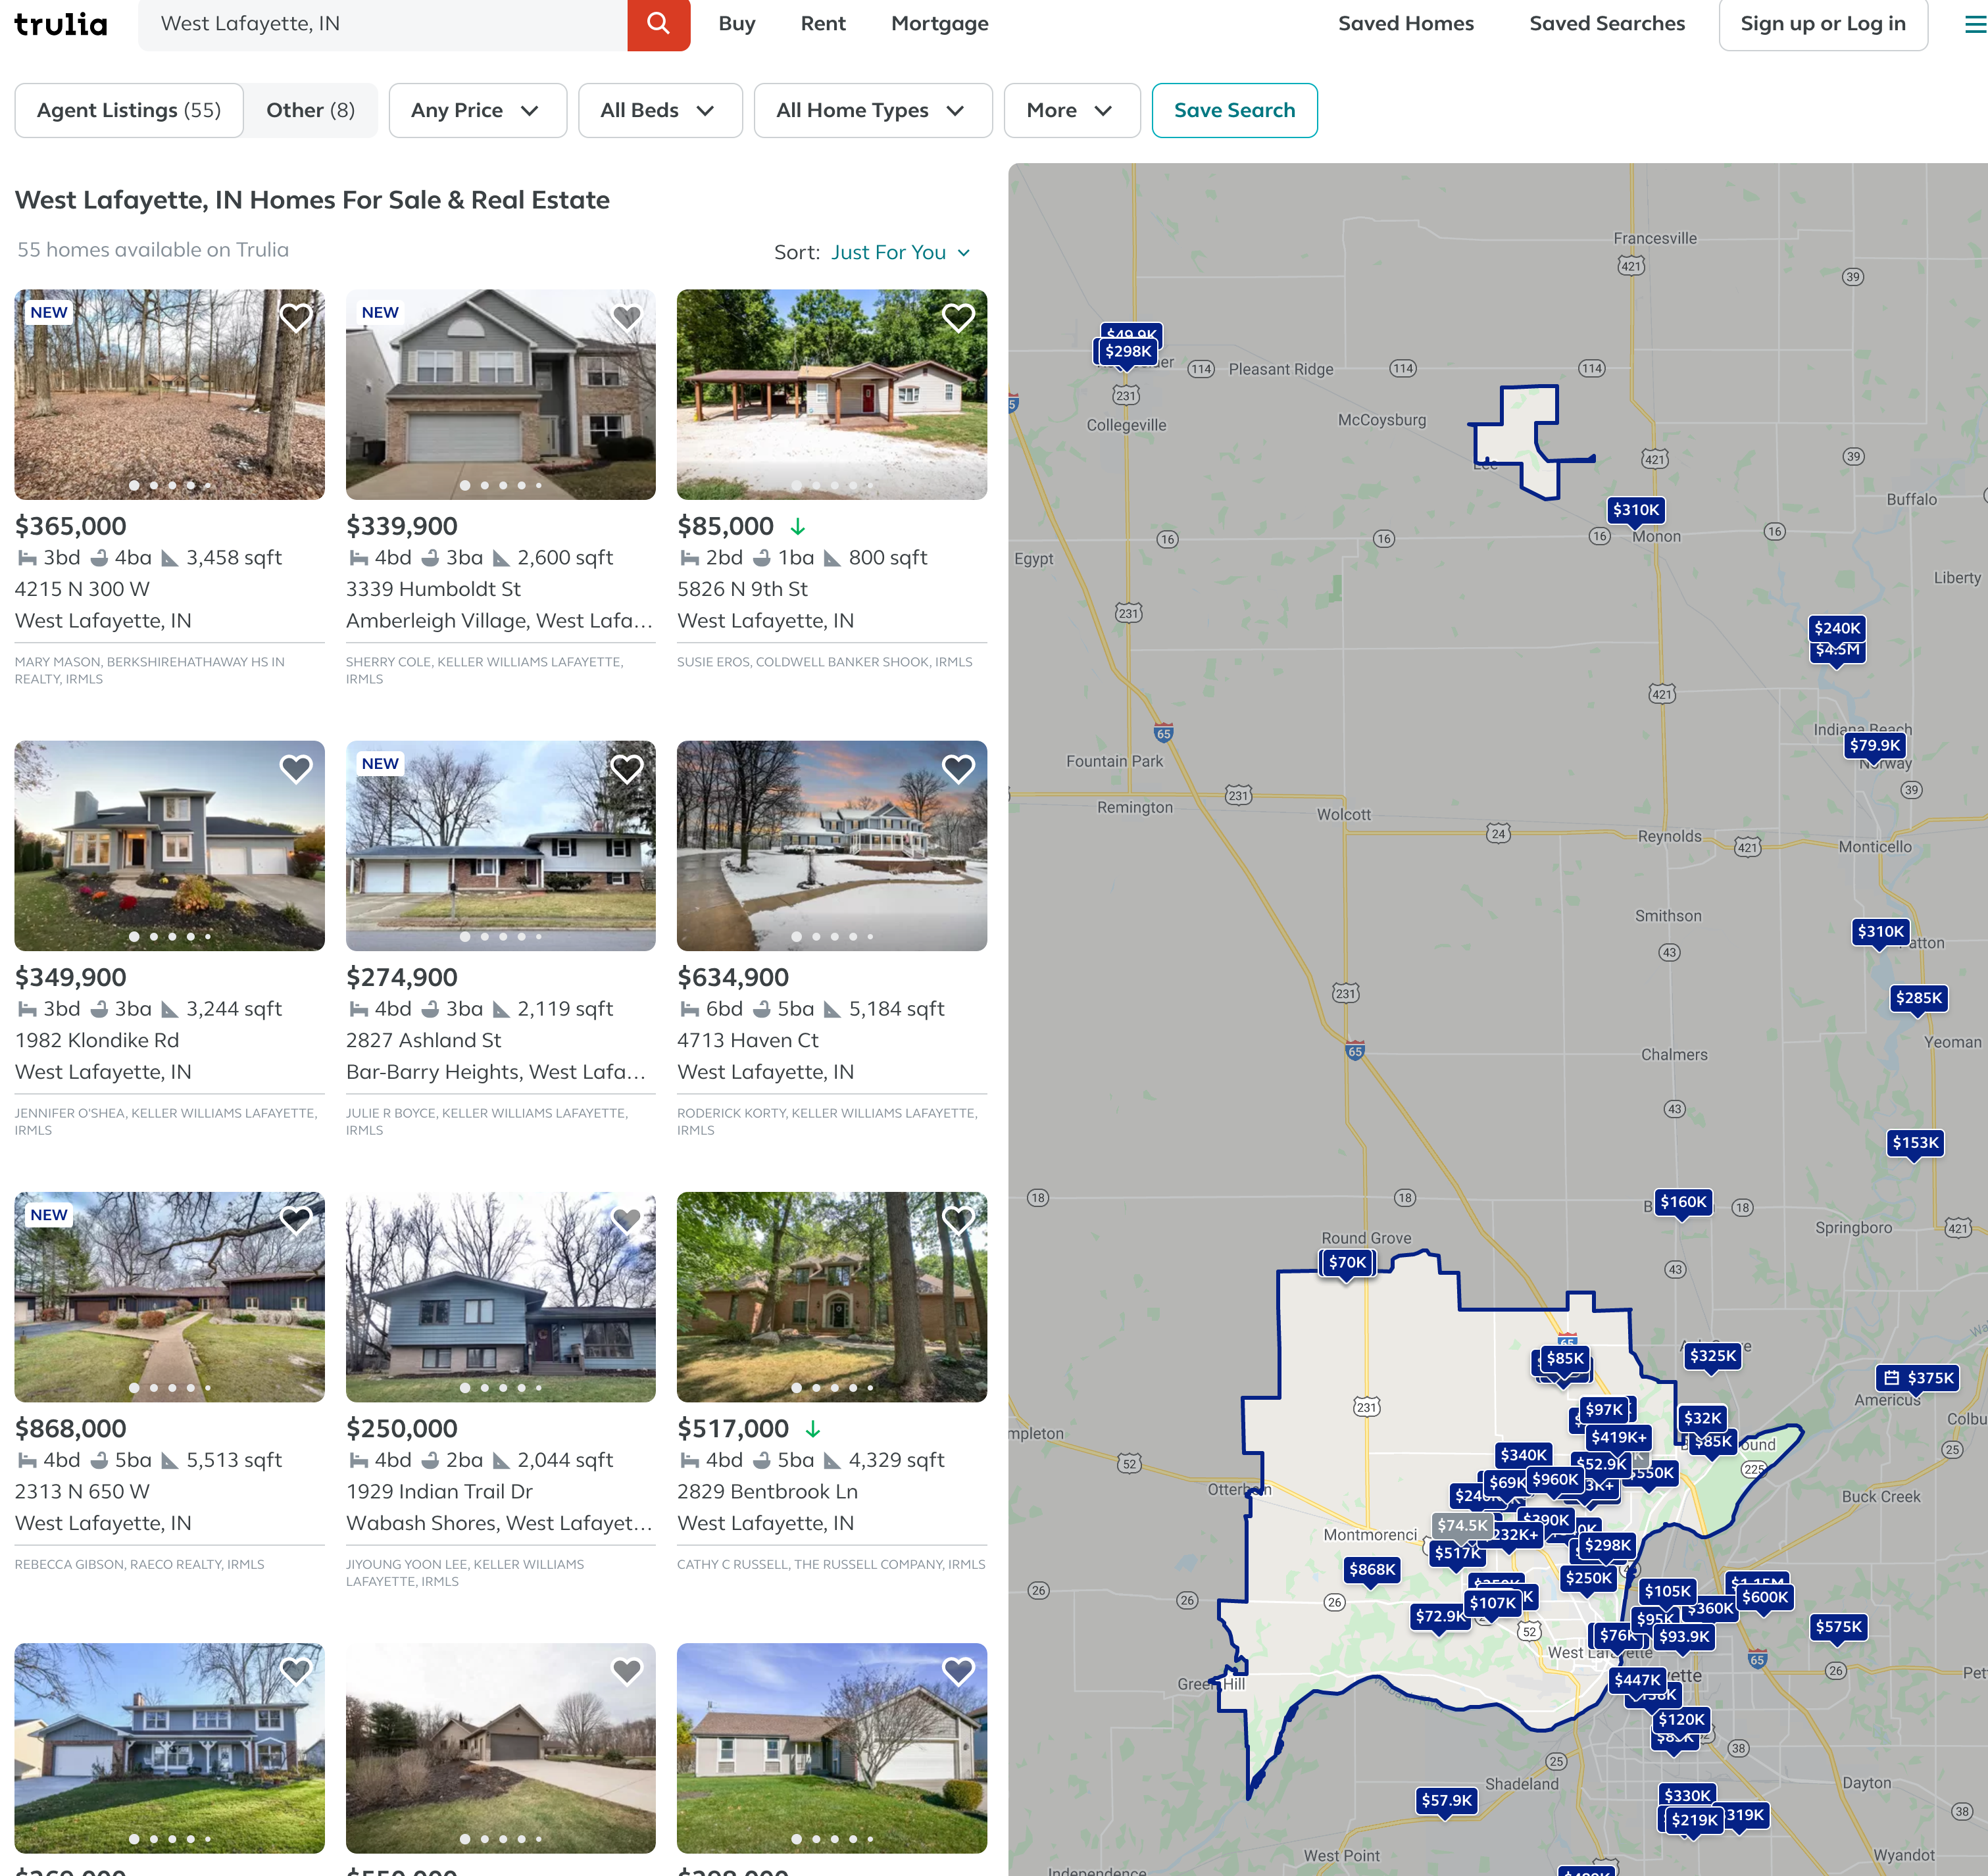
Use requests to scrape the entire page: https://www.trulia.com/IN/West_Lafayette/47906/. Use lxml.html to parse the page and get all of the img elements that make up the house pictures on the left side of the website.
Important note: Make sure you are actually scraping what you think you are scraping! Try printing your html to confirm it has the content you think it should have:
import requests
response = requests.get(...)
print(response.text)Hint: Are you human? Depends. Sometimes if you add a header to your request, it won't ask you if you are human. Let's pretend we are Firefox:
import requests
my_headers = {'User-Agent': 'Mozilla/5.0'}
response = requests.get(..., headers=my_headers)Okay, after all of that work you may have discovered that only a few images have actually been scraped. If you cycle through all of the img elements and try to print the value of the src attribute, this will be clear:
import lxml.html
tree = lxml.html.fromstring(response.text)
elements = tree.xpath("//img")
for element in elements:
print(element.attrib.get("src"))This is because the webpage is not immediately, completely loaded. This is a common website behavior to make things appear faster. If you pay close to when you load https://www.trulia.com/IN/Crawfordsville/47933/, and you quickly scroll down, you will see images still needing to finish rendering all of the way, slowly. What we need to do to fix this, is use selenium (instead of lxml.html) to behave like a human and scroll prior to scraping the page! Try using the following code to slowly scroll down the page before finding the elements:
# driver setup and get the url
# Needed to get the window size set right and scroll in headless mode
myheight = driver.execute_script('return document.body.scrollHeight')
driver.set_window_size(1080,myheight+100)
def scroll(driver, scroll_point):
driver.execute_script(f'window.scrollTo(0, {scroll_point});')
time.sleep(5)
scroll(driver, myheight*1/4)
scroll(driver, myheight*2/4)
scroll(driver, myheight*3/4)
scroll(driver, myheight*4/4)
# find_elements_by_*Hint: At the time of writing there should be about 86 links to images of homes.
Relevant topics: selenium, xml, loops
Item(s) to submit:
- Python code used to solve the problem.
- Output from running your code.
Solution
driver = webdriver.Firefox(options=firefox_options, executable_path='/Users/kamstut/Downloads/geckodriver')
url = 'https://www.trulia.com/IN/West_Lafayette/47906/'
driver.get(url)
# Needed to get the window size set right and scroll in headless mode
height = driver.execute_script('return document.body.scrollHeight')
driver.set_window_size(1080,height+100)
def scroll(driver, scroll_point):
driver.execute_script(f'window.scrollTo(0, {scroll_point});')
time.sleep(5)
scroll(driver, height/4)
scroll(driver, height/4*2)
scroll(driver, height/4*3)
scroll(driver, height)
elements = driver.find_elements_by_xpath("//picture/img")
print(len(elements))
for e in elements:
print(e.get_attribute("src"))4. Write a function called avg_house_cost that accepts a zip code as an argument, and returns the average cost of the first page of homes. Now, to make this a more meaningful statistic, filter for "3+" beds and then find the average. Test avg_house_cost out on the zip code 47906 and print the average costs.
Important note: Use selenium to "click" on the "3+ beds" filter.
Hint: If you get an error that tells you button is not clickable because it is covered by an li element, try clicking on the li element instead.
Hint: You will want to wait a solid 10-15 seconds for the sales page to load before trying to select or click on anything.
Hint: Your results may end up including prices for "Homes Near <ZIPCODE>". This is okay. Even better if you manage to remove those results. If you do choose to remove those results, take a look at the data-testid attribute with value search-result-list-container. Perhaps only selecting the children of the first element will get the desired outcome.
Hint: You can use the following code to remove the non-numeric text from a string, and then convert to an integer:
import re
int(re.sub("[^0-9]", "", "removenon45454_numbers$"))Relevant topics: selenium, xml, loops, functions
Item(s) to submit:
- Python code used to solve the problem.
- Output from running your code.
Solution
from selenium.webdriver.support.ui import WebDriverWait
import re
def avg_house_cost(zip: str) -> float:
firefox_options = Options()
firefox_options.add_argument("window-size=1920,1080")
# firefox_options.add_argument("--headless") # Headless mode means no GUI
firefox_options.add_argument("start-maximized")
firefox_options.add_argument("disable-infobars")
firefox_options.add_argument("--disable-extensions")
firefox_options.add_argument("--no-sandbox")
firefox_options.add_argument("--disable-dev-shm-usage")
firefox_options.binary_location = '/Applications/Firefox.app/Contents/MacOS/firefox'
driver = webdriver.Firefox(options=firefox_options, executable_path='/Users/kamstut/Downloads/geckodriver')
url = 'https://www.trulia.com/'
driver.get(url)
search_input = driver.find_element_by_id("banner-search")
search_input.send_keys(zip)
search_input.send_keys(Keys.RETURN)
time.sleep(10)
allbed_button = driver.find_element_by_xpath("//button[@data-testid='srp-xl-bedrooms-filter-button']/ancestor::li")
allbed_button.click()
time.sleep(2)
bed_button = driver.find_element_by_xpath("//button[contains(text(), '3+')]")
bed_button.click()
time.sleep(3)
price_elements = driver.find_elements_by_xpath("(//div[@data-testid='search-result-list-container'])[1]//div[@data-testid='property-price']")
prices = [int(re.sub("[^0-9]", "", e.text)) for e in price_elements]
driver.quit()
return sum(prices)/len(prices)
avg_house_cost('47906')5. Get creative. Either add an interesting feature to your function from (4), or use matplotlib to generate some sort of accompanying graphic with your output. Make sure to explain what your additions do.
Relevant topics: selenium, xml, loops
Item(s) to submit:
- Python code used to solve the problem.
- Output from running your code.
Solution
Could be anything.
Project 4
Motivation: In this project we will continue to hone your web scraping skills, introduce you to some "gotchas", and give you a little bit of exposure to a powerful tool called cron.
Context: We are in the second to last project focused on web scraping. This project will introduce some supplementary tools that work well with web scraping: cron, sending emails from Python, etc.
Scope: python, web scraping, selenium, cron
Learning objectives:
- Review and summarize the differences between XML and HTML/CSV.
- Use the requests package to scrape a web page.
- Use the lxml package to filter and parse data from a scraped web page.
- Use the beautifulsoup4 package to filter and parse data from a scraped web page.
- Use selenium to interact with a browser in order to get a web page to a desired state for scraping.
Make sure to read about, and use the template found here, and the important information about projects submissions here.
Questions
1. Check out the following website: https://project4.tdm.wiki
Use selenium to scrape and print the 6 colors of pants offered.
Click here for video for Question 1
Hint: You may have to interact with the webpage for certain elements to render.
Relevant topics: scraping, selenium, example clicking a button
Item(s) to submit:
- Python code used to solve the problem.
- Output from running your code.
Solution
from selenium import webdriver
from selenium.webdriver.common.keys import Keys
from selenium.webdriver.firefox.options import Options
from selenium.common.exceptions import NoSuchElementException
import timedriver.get("https://project4.tdm.wiki/")
elements = driver.find_elements_by_xpath("//span[@class='ui-component-card--color-amount']")
for element in elements:
print(element.text)
# click the "wild colors" button
label = driver.find_element_by_xpath("//label[@for='ui-component-toggle__wild']")
label.click()
elements = driver.find_elements_by_xpath("//span[@class='ui-component-card--color-amount']")
for element in elements:
print(element.text)
driver.quit()2. Websites are updated frequently. You can imagine a scenario where a change in a website is a sign that there is more data available, or that something of note has happened. This is a fake website designed to help students emulate real changes to a website. Specifically, there is one part of the website that has two possible states (let's say, state A and state B). Upon refreshing the website, or scraping the website again, there is an \(x\%\) chance that the website will be in state A and a \(1-x\%\) chance the website will be in state B.
Describe the two states (the thing (element or set of elements) that changes as you refresh the page), and scrape the website enough to estimate \(x\).
Click here for video for Questions 2 and 3
Hint: You will need to interact with the website to "see" the change.
Hint: Since we are just asking about a state, and not any specific element, you could use the page_source attribute of the selenium driver to scrape the entire page instead of trying to use xpath expressions to find a specific element.
Hint: Your estimate of \(x\) does not need to be perfect.
Relevant topics: scraping, selenium, example clicking a button
Item(s) to submit:
- Python code used to solve the problem.
- Output from running your code.
-
What state
AandBrepresent. -
An estimate for
x.
Solution
25% in stock 75% out of stock -- anything remotely close give full credit
# The state of the Chartreuse pants, sold out (A) or in stock (B)
driver = webdriver.Firefox(options=firefox_options, executable_path='/class/datamine/apps/geckodriver')
driver.get("https://project4.tdm.wiki/")
# click the "wild colors" button
label = driver.find_element_by_xpath("//label[@for='ui-component-toggle__wild']")
label.click()
stateA = driver.page_source
stateAct = 0
stateBct = 0
for i in range(10):
driver = webdriver.Firefox(options=firefox_options, executable_path='/class/datamine/apps/geckodriver')
driver.get("https://project4.tdm.wiki/")
# click the "wild colors" button
label = driver.find_element_by_xpath("//label[@for='ui-component-toggle__wild']")
label.click()
if driver.page_source == stateA:
stateAct += 1
else:
stateBct += 1
driver.quit()
print(f"State A: {stateAct}")
print(f"State B: {stateBct}")3. Dig into the changing "thing" from question (2). What specifically is changing? Use selenium and xpath expressions to scrape and print the content. What are the two possible values for the content?
Click here for video (same as above) for Questions 2 and 3
Hint: Due to the changes that occur when a button is clicked, I'd highly advice you to use the data-color attribute in your xpath expression instead of contains(text(), 'blahblah').
Hint: parent:: and following-sibling:: may be useful xpath axes to use.
Relevant topics: scraping, selenium, example using following-sibling::
Item(s) to submit:
- Python code used to solve the problem.
- Output from running your code.
Solution
# The state of the Chartreuse pants, sold out (A) or in stock (B)
driver = webdriver.Firefox(options=firefox_options, executable_path='/class/datamine/apps/geckodriver')
driver.get("https://project4.tdm.wiki/")
# click the "wild colors" button
label = driver.find_element_by_xpath("//label[@for='ui-component-toggle__wild']")
label.click()
element = driver.find_element_by_xpath("//span[@data-color='Chartreuse']/parent::div/following-sibling::div/span")
print(element.text)
driver.quit()4. The following code allows you to send an email using Python from your Purdue email account. Replace the username and password with your own information and send a test email to yourself to ensure that it works.
Click here for video for Questions 4 and 5
Important note: Do NOT include your password in your homework submission. Any time you need to type your password in you final submission just put something like "SUPERSECRETPASSWORD" or "MYPASSWORD".
Hint: To include an image (or screenshot) in RMarkdown, try  where my_image.png is inside the same folder as your .Rmd file.
Hint: The spacing and tabs near the message variable are very important. Make sure to copy the code exactly. Otherwise, your subject may not end up in the subject of your email, or the email could end up being blank when sent.
Hint: Questions 4 and 5 were inspired by examples and borrowed from the code found at the Real Python website.
def send_purdue_email(my_purdue_email, my_password, to, my_subject, my_message):
import smtplib, ssl
from email.mime.text import MIMEText
from email.mime.multipart import MIMEMultipart
message = MIMEMultipart("alternative")
message["Subject"] = my_subject
message["From"] = my_purdue_email
message["To"] = to
# Create the plain-text and HTML version of your message
text = f'''\
Subject: {my_subject}
To: {to}
From: {my_purdue_email}
{my_message}'''
html = f'''\
<html>
<body>
{my_message}
</body>
</html>
'''
# Turn these into plain/html MIMEText objects
part1 = MIMEText(text, "plain")
part2 = MIMEText(html, "html")
# Add HTML/plain-text parts to MIMEMultipart message
# The email client will try to render the last part first
message.attach(part1)
message.attach(part2)
context = ssl.create_default_context()
with smtplib.SMTP("smtp.purdue.edu", 587) as server:
server.ehlo() # Can be omitted
server.starttls(context=context)
server.ehlo() # Can be omitted
server.login(my_purdue_email, my_password)
server.sendmail(my_purdue_email, to, message.as_string())
# this sends an email from kamstut@purdue.edu to mdw@purdue.edu
# replace supersecretpassword with your own password
# do NOT include your password in your homework submission.
send_purdue_email("kamstut@purdue.edu", "supersecretpassword", "mdw@purdue.edu", "put subject here", "put message body here")Relevant topics: functions
Item(s) to submit:
- Python code used to solve the problem.
- Output from running your code.
- Screenshot showing your received the email.
Solution
import smtplib, ssl
port = 587 # For starttls
smtp_server = "smtp.purdue.edu"
sender_email = "kamstut@purdue.edu"
receiver_email = "kamstut@purdue.edu"
password = "MYPASSWORD"
message = """\
Subject: Hi there
This message is sent from Python."""
context = ssl.create_default_context()
with smtplib.SMTP(smtp_server, port) as server:
server.ehlo() # Can be omitted
server.starttls(context=context)
server.ehlo() # Can be omitted
server.login(sender_email, password)
server.sendmail(sender_email, receiver_email, message)5. The following is the content of a new Python script called is_in_stock.py:
def send_purdue_email(my_purdue_email, my_password, to, my_subject, my_message):
import smtplib, ssl
from email.mime.text import MIMEText
from email.mime.multipart import MIMEMultipart
message = MIMEMultipart("alternative")
message["Subject"] = my_subject
message["From"] = my_purdue_email
message["To"] = to
# Create the plain-text and HTML version of your message
text = f'''\
Subject: {my_subject}
To: {to}
From: {my_purdue_email}
{my_message}'''
html = f'''\
<html>
<body>
{my_message}
</body>
</html>
'''
# Turn these into plain/html MIMEText objects
part1 = MIMEText(text, "plain")
part2 = MIMEText(html, "html")
# Add HTML/plain-text parts to MIMEMultipart message
# The email client will try to render the last part first
message.attach(part1)
message.attach(part2)
context = ssl.create_default_context()
with smtplib.SMTP("smtp.purdue.edu", 587) as server:
server.ehlo() # Can be omitted
server.starttls(context=context)
server.ehlo() # Can be omitted
server.login(my_purdue_email, my_password)
server.sendmail(my_purdue_email, to, message.as_string())
def main():
# scrape element from question 3
# does the text indicate it is in stock?
# if yes, send email to yourself telling you it is in stock.
# otherwise, gracefully end script using the "pass" Python keyword
if __name__ == "__main__":
main()First, make a copy of the script in your $HOME directory:
cp /class/datamine/data/scraping/is_in_stock.py $HOME/is_in_stock.pyThe script should now appear in RStudio, in your home directory, with the correct permissions. Open the script (in RStudio) and fill in the main function as indicated by the comments. We want the script to scrape to see whether the pants from question 3 are in stock or not.
A cron job is a task that runs at a certain interval. Create a cron job that runs your script, /class/datamine/apps/python/f2020-s2021/env/bin/python $HOME/is_in_stock.py every 5 minutes. Wait 10-15 minutes and verify that it is working properly. The long path, /class/datamine/apps/python/f2020-s2021/env/bin/python simply makes sure that our script is run with access to all of the packages in our course environment. $HOME/is_in_stock.py is the path to your script ($HOME expands or transforms to /home/<my_purdue_alias>.
Click here for video (same as above) for Questions 4 and 5
Click here for a longer video about setting up the cronjob in Question 5
Hint: If you struggle to use the text editor used with the crontab -e command, be sure to continue reading the cron section of the book. We highlight another method that may be easier.
Hint: Don't forget to copy your import statements from question (3) as well.
Important note: Once you are finished with the project, if you no longer wish to receive emails every so often, follow the instructions here to remove the cron job.
Relevant topics: cron, crontab guru
Item(s) to submit:
- Python code used to solve the problem.
- Output from running your code.
- The content of your cron job in a bash code chunk.
-
The content of your
is_in_stock.pyscript.
Solution
*/5 * * * * /home/kamstut/is_in_stock.py#!/usr/bin/env python3
def send_purdue_email(my_purdue_email, my_password, to):
import smtplib, ssl
port = 587 # For starttls
smtp_server = "smtp.purdue.edu"
sender_email = my_purdue_email
receiver_email = to
password = my_password
message = """\
Subject: Test subject
This is the email body."""
context = ssl.create_default_context()
with smtplib.SMTP(smtp_server, port) as server:
server.ehlo() # Can be omitted
server.starttls(context=context)
server.ehlo() # Can be omitted
server.login(sender_email, password)
server.sendmail(sender_email, receiver_email, message)
def main():
# scrape element from question 3
# The state of the Chartreuse pants, sold out (A) or in stock (B)
driver = webdriver.Firefox(options=firefox_options, executable_path='/class/datamine/apps/geckodriver')
driver.get("https://project4.tdm.wiki/")
# click the "wild colors" button
label = driver.find_element_by_xpath("//label[@for='ui-component-toggle__wild']")
label.click()
element = driver.find_element_by_xpath("//span[@data-color='Chartreuse']/parent::div/following-sibling::div/span")
# does the text indicate it is in stock?
if element.text == "In stock":
# if yes, send email to yourself telling you it is in stock.
send_purdue_email("kamstut@purdue.edu", "MYPASSWORD", "kamstut@purdue.edu")
# otherwise, gracefully end script using the "pass" Python keyword
else:
pass
if __name__ == "__main__":
main()Project 5
Motivation: One of the best things about learning to scrape data is the many applications of the skill that may pop into your mind. In this project, we want to give you some flexibility to explore your own ideas, but at the same time, add a couple of important tools to your tool set. We hope that you've learned a lot in this series, and can think of creative ways to utilize your new skills.
Context: This is the last project in a series focused on scraping data. We have created a couple of very common scenarios that can be problematic when first learning to scrape data, and we want to show you how to get around them.
Scope: python, web scraping, etc.
Learning objectives:
- Use the requests package to scrape a web page.
- Use the lxml/selenium package to filter and parse data from a scraped web page.
- Learn how to step around header-based filtering.
- Learn how to handle rate limiting.
Make sure to read about, and use the template found here, and the important information about projects submissions here.
Questions
1. It is not uncommon to be blocked from scraping a website. There are a variety of strategies that they use to do this, and in general they work well. In general, if a company wants you to extract information from their website, they will make an API (application programming interface) available for you to use. One method (that is commonly paired with other methods) is blocking your request based on headers. You can read about headers here. In general, you can think of headers as some extra data that gives the server or client context. Here is a list of headers, and some more explanation.
Each header has a purpose. One common header is called the User-Agent header. A User-Agent looks something like:
User-Agent: Mozilla/5.0 (Macintosh; Intel Mac OS X 10.16; rv:86.0) Gecko/20100101 Firefox/86.0You can see headers if you open the console in Firefox or Chrome and load a website. It will look something like:
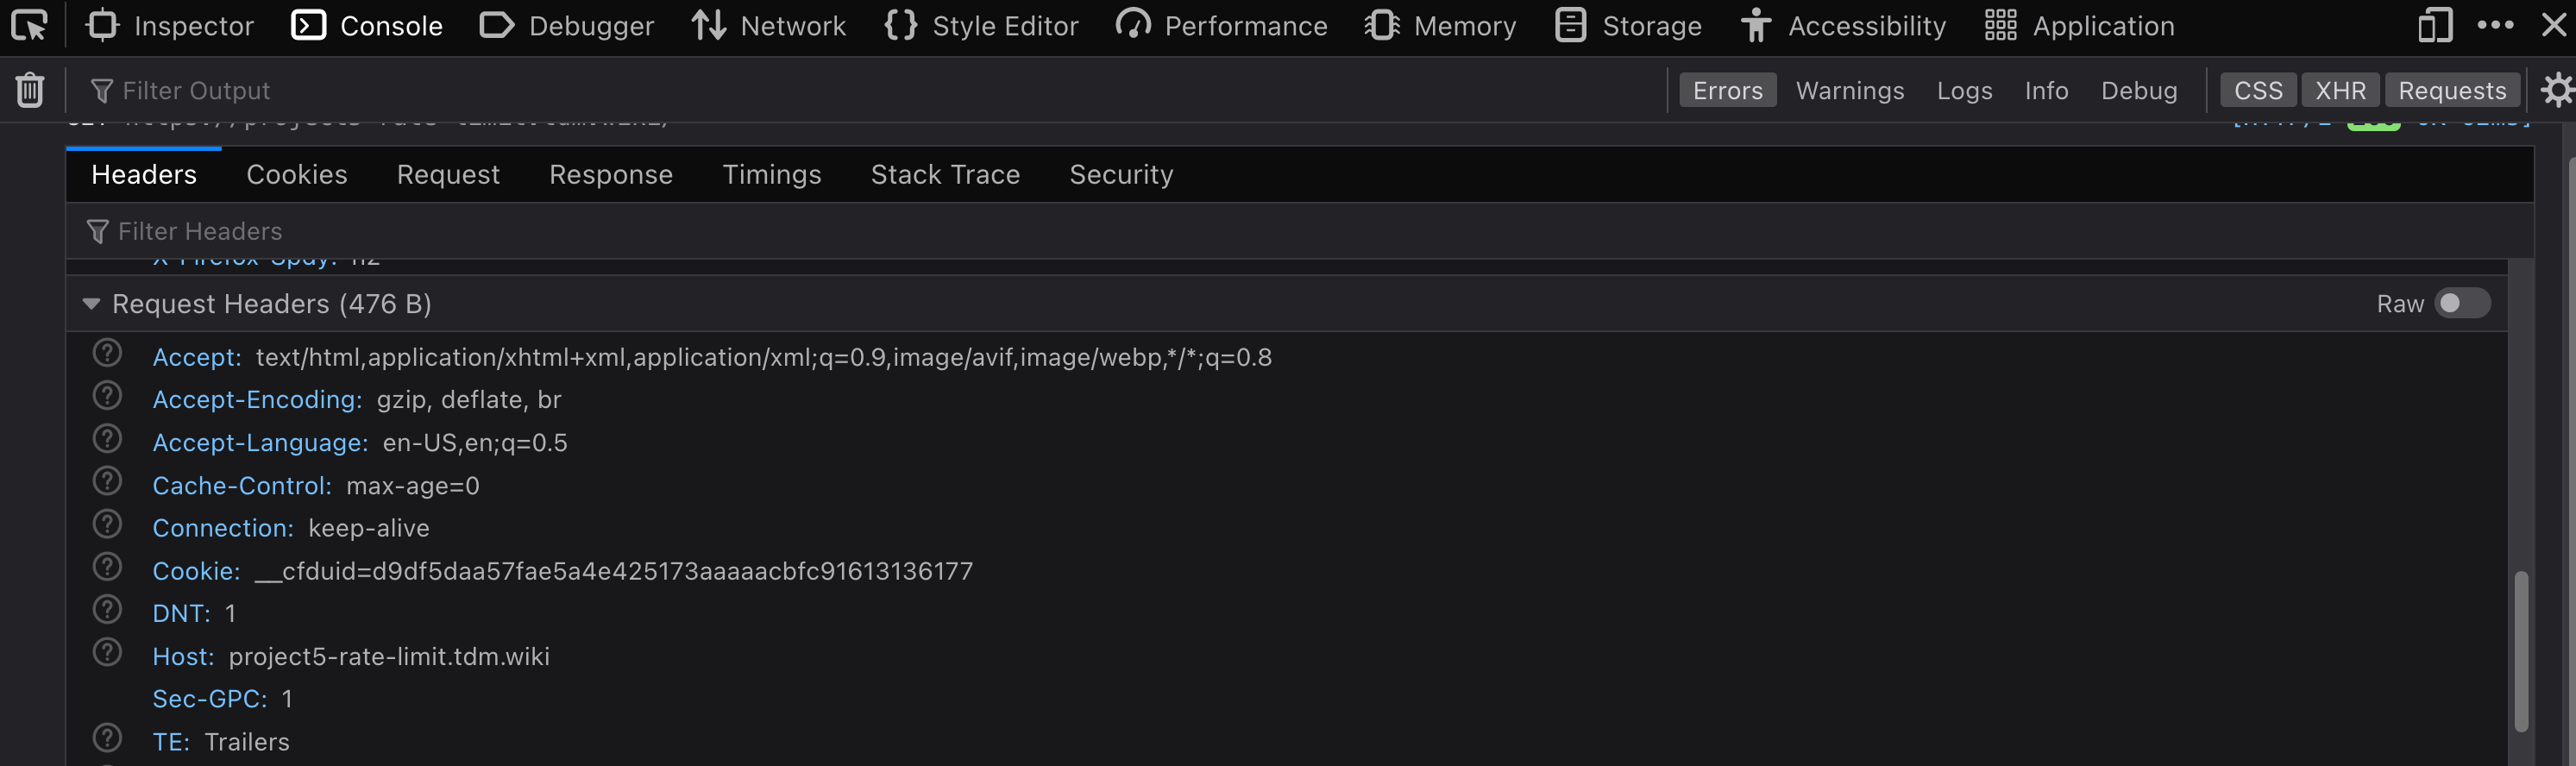
From the mozilla link, this header is a string that "lets servers and network peers identify the application, operating system, vendor, and/or version of the requesting user agent." Basically, if you are browsing the internet with a common browser, the server will know what you are using. In the provided example, we are using Firefox 86 from Mozilla, on a Mac running Mac OS 10.16 with an Intel processor.
When we send a request from a package like requests in Python, here is what the headers look like:
import requests
response = requests.get("https://project5-headers.tdm.wiki")
print(response.request.headers){'User-Agent': 'python-requests/2.25.1', 'Accept-Encoding': 'gzip, deflate', 'Accept': '*/*', 'Connection': 'keep-alive'}As you can see our User-Agent is python-requests/2.25.1. You will find that many websites block requests made from anything such user agents. One such website is: https://project5-headers.tdm.wiki.
Scrape https://project5-headers.tdm.wiki from Scholar and explain what happens. What is the response code, and what does that response code mean? Can you ascertain what you would be seeing (more or less) in a browser based on the text of the response (the actual HTML)? Read this section of the documentation for the headers package, and attempt to "trick" https://project5-headers.tdm.wiki into presenting you with the desired information. The desired information should look something like:
Hostname: c1de5faf1daa
IP: 127.0.0.1
IP: 172.18.0.4
RemoteAddr: 172.18.0.2:34520
GET / HTTP/1.1
Host: project5-headers.tdm.wiki
User-Agent: Mozilla/5.0 (Macintosh; Intel Mac OS X 10.16; rv:86.0) Gecko/20100101 Firefox/86.0
Accept: text/html,application/xhtml+xml,application/xml;q=0.9,image/avif,image/webp,*/*;q=0.8
Accept-Encoding: gzip
Accept-Language: en-US,en;q=0.5
Cdn-Loop: cloudflare
Cf-Connecting-Ip: 107.201.65.5
Cf-Ipcountry: US
Cf-Ray: 62289b90aa55f975-EWR
Cf-Request-Id: 084d3f8e740000f975e0038000000001
Cf-Visitor: {"scheme":"https"}
Cookie: __cfduid=d9df5daa57fae5a4e425173aaaaacbfc91613136177
Dnt: 1
Sec-Gpc: 1
Upgrade-Insecure-Requests: 1
X-Forwarded-For: 123.123.123.123
X-Forwarded-Host: project5-headers.tdm.wiki
X-Forwarded-Port: 443
X-Forwarded-Proto: https
X-Forwarded-Server: 6afe64faffaf
X-Real-Ip: 123.123.123.123Relevant topics: requests
Item(s) to submit:
- Python code used to solve the problem.
- Response code received (a number), and an explanation of what that HTTP response code means.
- What you would (probably) be seeing in a browser if you were blocked.
- Python code used to "trick" the website into being scraped.
- The content of the successfully scraped site.
Solution
import requests
response = requests.get("https://project5-headers.tdm.wiki")
print(response.status_code) # 403
# 403 is an https response code that means the content is forbidden
# based on the HTML it looks like we'd be presented with a CAPTCHA
print(response.text)
# to fix this, let's change our User-Agent header
response = requests.get("https://project5-headers.tdm.wiki", headers={"User-Agent": "anything"})
print(response.text)
# or even better, would be to "fake" a browser
response = requests.get("https://project5-headers.tdm.wiki", headers={"User-Agent": "Mozilla/5.0 (Macintosh; Intel Mac OS X 10.16; rv:86.0) Gecko/20100101 Firefox/86.0"})
print(response.text)The following function tries to scrape the Cf-Request-Id header which will have a unique value each request:
import requests
import lxml.html
def scrape_cf_request_id(url):
resp = requests.get(url)
tree = lxml.html.fromstring(resp.text)
content = tree.xpath("//p")[0].text.split('\n')
cfid = [l for l in content if 'Cf-Request-Id' in l][0].split()[1]
return cfidYou can test it out:
scrape_cf_request_id("https://project5-rate-limit.tdm.wiki")Write code to scrape 10 unique Cf-Request-Ids (in a loop), and save them to a list called my_ids. What happens when you run the code? This is caused by our expected text not being present. Instead text with "Too Many Requests" is. While normally this error would be something that makes more sense, like an HTTPError or a Timeout Exception, it could be anything, depending on your code.
One solution that might come to mind is to "wait" between each loop using time.sleep(). While yes, this may work, it is not a robust solution. Other users from your IP address may count towards your rate limit and cause your function to fail, the amount of sleep time may change dynamically, or even be manually adjusted to be longer, etc. The best way to handle this is to used something called exponential backoff.
In a nutshell, exponential backoff is a way to increase the wait time (exponentially) until an acceptable rate is found. backoff is an excellent package to do just that. backoff, upon being triggered from a specified error or exception, will wait to "try again" until a certain amount of time has passed. Upon receving the same error or exception, the time to wait will increase exponentially. Use backoff to modify the provided scrape_cf_request_id function to use exponential backoff when the we alluded to occurs. Test out the modified function in a loop and print the resulting 10 Cf-Request-Ids.
Note: backoff utilizes decorators. For those interested in learning about decorators, this is an excellent article.
Relevant topics: requests
Item(s) to submit:
- Python code used to solve the problem.
- What happens when you run the function 10 times in a row?
- Fixed code that will work regardless of the rate limiting.
-
10 unique
Cf-Request-Ids printed.
Solution
import requests
import lxml.html
# function to scrape the Cf-Request-Id
def scrape_cf_request_id(url):
resp = requests.get(url)
tree = lxml.html.fromstring(resp.text)
content = tree.xpath("//p")[0].text.split('\n')
cfid = [l for l in content if 'Cf-Request-Id' in l][0].split()[1]
print(cfid)
my_list = []
for i in range(10):
my_list.append(scrape_cf_request_id("https://project5-rate-limit.tdm.wiki"))
This will cause an IndexError because the expected content containing the Cf-Request-Id is not present, instead "Too Many Requests" is.
import backoff
from lxml import etree
@backoff.on_exception(backoff.expo,
IndexError)
def scrape_cf_request_id(url):
resp = requests.get(url, headers={"User-Agent": "something"})
tree = lxml.html.fromstring(resp.text)
content = tree.xpath("//p")[0].text.split('\n')
cfid = [l for l in content if 'Cf-Request-Id' in l][0].split()[1]
print(cfid)
my_list = []
for i in range(10):
my_list.append(scrape_cf_request_id("https://project5-rate-limit.tdm.wiki"))
print(my_list)3. You now have a great set of tools to be able to scrape pretty much anything you want from the internet. Now all that is left to do is practice. Find a course appropriate website containing data you would like to scrape. Utilize the tools you've learned about to scrape at least 100 "units" of data. A "unit" is just a representation of what you are scraping. For example, a unit could be a tweet from Twitter, a basketball player's statistics from sportsreference, a product from Amazon, a blog post from your favorite blogger, etc.
The hard requirements are:
- Documented code with thorough comments explaining what the code does.
- At least 100 "units" scraped.
- The data must be from multiple web pages.
- Write at least 1 function (with a docstring) to help you scrape.
- A clear explanation of what your scraper scrapes, challenges you encountered (if any) and how you overcame them, and a sample of your data printed out (for example a
headof a pandas dataframe containing the data).
Item(s) to submit:
- Python code that scrapes 100 unites of data (with thorough comments explaining what the code does).
- The data must be from more than a single web page.
- 1 or more functions (with docstrings) used to help you scrape/parse data.
-
Clear documentation and explanation of what your scraper scrapes, challenges you encountered (if any) and how you overcame them, and a sample of your data printed out (for example using the
headof a dataframe containing the data).
Solution
- Python code with comments
- Sample of scraped data (must be from multiple pages)
- At least 100 "units" of scraped data (for example 1 tweet == 1 unit, 1 product from amazon == 1 unit, etc.)
- At least 1 helper function with a docstring
- A paragraph explaining things
Project 6
Motivation: Being able to analyze and create good visualizations is a skill that is invaluable in many fields. It can be pretty fun too! In this project, we are going to dive into matplotlib with an open project.
Context: We've been working hard all semester and learning a lot about web scraping. In this project we are going to ask you to examine some plots, write a little bit, and use your creative energies to create good visualizations about the flight data using the go-to plotting library for many, matplotlib. In the next project, we will continue to learn about and become comfortable using matplotlib.
Scope: python, visualizing data
Learning objectives:
- Demonstrate the ability to create basic graphs with default settings.
- Demonstrate the ability to modify axes labels and titles.
- Demonstrate the ability to customize a plot (color, shape/linetype).
Make sure to read about, and use the template found here, and the important information about projects submissions here.
Dataset
The following questions will use the dataset found in Scholar:
/class/datamine/data/flights/*.csv (all csv files)
Questions
2. Creating More Effective Graphs by Dr. Naomi Robbins and The Elements of Graphing Data by Dr. William Cleveland at Purdue University, are two excellent books about data visualization. Read the following excerpts from the books (respectively), and list 2 things you learned, or found interesting from each book.
Item(s) to submit:
- Two bullets for each book with items you learned or found interesting.
3. Of the 7 posters with at least 3 plots and/or maps, choose 1 poster that you think you could improve upon or "out plot". Create 4 plots/maps that either:
- Improve upon a plot from the poster you chose, or
- Show a completely different plot that does a good job of getting an idea or observation across, or
- Ruin a plot. Purposefully break the best practices you've learned about in order to make the visualization misleading. (limited to 1 of the 4 plots)
For each plot/map where you choose to do (1), include 1-2 sentences explaining what exactly you improved upon and how. Point out some of the best practices from the 2 provided texts that you followed. For each plot/map where you choose to do (2), include 1-2 sentences explaining your graphic and outlining the best practices from the 2 texts that you followed. For each plot/map where you choose to do (3), include 1-2 sentences explaining what you changed, what principle it broke, and how it made the plot misleading or worse.
While we are not asking you to create a poster, please use RMarkdown to keep your plots, code, and text nicely formatted and organized. The more like a story your project reads, the better. In this project, we are restricting you to use matplotlib in Python. While there are many interesting plotting packages like plotly and plotnine, we really want you to take the time to dig into matplotlib and learn as much as you can.
Item(s) to submit:
- All associated Python code you used to wrangling the data and create your graphics.
- 4 plots, with at least 4 associated RMarkdown code chunks.
- 1-2 sentences per plot explaining what exactly you improved upon, what best practices from the texts you used, and how. If it is a brand new visualization, describe and explain your graphic, outlining the best practices from the 2 texts that you followed. If it is the ruined plot you chose, explain what you changed, what principle it broke, and how it made the plot misleading or worse.
4. Now that you've been exploring data visualization, copy, paste, and update your first impressions from question (1) with your updated impressions. Which impression changed the most, and why?
Item(s) to submit:
- 8 bullets with updated impressions (still just a sentence or two) from question (1).
- A sentence explaining which impression changed the most and why.
Project 7
Motivation: Being able to analyze and create good visualizations is a skill that is invaluable in many fields. It can be pretty fun too! As you probably noticed in the previous project, matplotlib can be finicky -- certain types of plots are really easy to create, while others are not. For example, you would think changing the color of a boxplot would be easy to do in matplotlib, perhaps we just need to add an option to the function call. As it turns out, this isn't so straightforward (as illustrated at the end of this section). Occasionally this will happen and that is when packages like seaborn or plotnine (both are packages built using matplotlib) can be good. In this project we will explore this a little bit, and learn about some useful pandas functions to help shape your data in a format that any given package requires.
Context: In the next project, we will continue to learn about and become comfortable using matplotlib, seaborn, and plotnine.
Scope: python, visualizing data
Learning objectives:
- Demonstrate the ability to create basic graphs with default settings.
- Demonstrate the ability to modify axes labels and titles.
- Demonstrate the ability to customize a plot (color, shape/linetype).
Make sure to read about, and use the template found here, and the important information about projects submissions here.
Dataset
The following questions will use the dataset found in Scholar:
/class/datamine/data/apple/health/watch_dump.xml
Questions
2. The plot in question 1 should look bimodal. Let's focus only on the first apparent group of readings. Create a new dataframe containing only the readings for the time period from 9/1/2017 to 5/31/2019. How many Records are there in that time period?
Relevant topics: lxml, groupby, barplot
Item(s) to submit:
- Python code used to solve the problem.
- Output from running your code.
3. It is hard to discern weekly patterns (if any) based on the graphics created so far. For the period of time in question 2, create a labeled bar plot for the count of Records by day of the week. What (if any) discernable patterns are there? Make sure to include the labels provided below:
labels = ["Mon", "Tue", "Wed", "Thu", "Fri", "Sat", "Sun"]Relevant topics: lxml, groupby, barplot
Item(s) to submit:
- Python code used to solve the problem.
- Output from running your code (including the graphic).
4. Create a pandas dataframe containing the following data from watch_dump.xml:
- A column called
bpmwith thebpm(beats per minute) of theInstantaneousBeatsPerMinute. - A column called
timewith thetimeof each individualbpmreading inInstantaneousBeatsPerMinute. - A column called
datewith the date. - A column called
dayofweekwith the day of the week.
Hint: You may want to use pd.to_numeric to convert the bpm column to a numeric type.
Hint: This is one way to convert the numbers 0-6 to days of the week:
myDF['dayofweek'] = myDF['dayofweek'].map({0:"Mon", 1:"Tue", 2:"Wed", 3:"Thu", 4:"Fri", 5: "Sat", 6: "Sun"})Relevant topics: lxml, groupby, barplot
Item(s) to submit:
- Python code used to solve the problem.
- Output from running your code.
5. Create a heatmap using seaborn, where the y-axis shows the day of the week ("Mon" - "Sun"), the x-axis shows the hour, and the values on the interior of the plot are the average bpm by hour by day of the week.
Relevant topics: lxml, groupby, pivot
Item(s) to submit:
- Python code used to solve the problem.
- Output from running your code (including the graphic).
Project 8
Motivation: Python is an interpreted language (as opposed to a compiled language). In a compiled language, you are (mostly) unable to run and evaluate a single instruction at a time. In Python (and R -- also an interpreted language), we can run and evaluate a line of code easily using a repl. In fact, this is the way you've been using Python to date -- selecting and running pieces of Python code. Other ways to use Python include creating a package (like numpy, pandas, and pytorch), and creating scripts. You can create powerful CLI's (command line interface) tools using Python. In this project, we will explore this in detail and learn how to create scripts that accept options and input and perform tasks.
Context: This is the first (of two) projects where we will learn about creating and using Python scripts.
Scope: python
Learning objectives:
- Write a python script that accepts user inputs and returns something useful.
Make sure to read about, and use the template found here, and the important information about projects submissions here.
Questions
1. Often times the deliverable part of a project isn’t custom built packages or modules, but a script. A script is a .py file with python code written inside to perform action(s). Python scripts are incredibly easy to run, for example, if you had a python script called question01.py, you could run it by opening a terminal and typing:
python3 /path/to/question01.pyThe python interpreter then looks for the scripts entrypoint, and starts executing. You should read this article about the main function and python scripts. In addition, read this section, paying special attention to the shebang.
Create a Python script called question01.py in your $HOME directory. Use the second shebang from the article: #!/usr/bin/env python3. When run, question01.py should use the sys package to print the location of the interpreter being used to run the script. For example, if we started a Python interpreter in RStudio using the following code:
datamine_py()
reticulate::repl_python()Then, we could print the interpreter by running the following Python code one line at a time:
import sys
print(sys.executable)Since we are using our Python environment, you should see this result: /class/datamine/apps/python/f2020-s2021/env/bin/python3. This is the fully qualified path of the Python interpreter we've been using for this course.
2. Was your output in question (1) expected? Why or why not?
When we restarted the R session, our datamine_py's effects were reversed, and the default Python interpreter is no longer our default when running python3. It is very common to have a multitude of Python environments available to use. But, when we are running a Python script it is not convenient to have to run various commands (in our case, the single datamine_py command) in order to get our script to run the way we want it to run. In addition, if our script used a set of packages that were not installed outside of our course environment, the script would fail.
In this project, since our focus is more on how to write scripts and make them work as expected, we will have some fun and experiment with some pre-trained state of the art machine learning models.
The following function accepts a string called sentence as an input and returns the sentiment of the sentence, "POSITIVE" or "NEGATIVE".
from transformers import pipeline
def get_sentiment(model, sentence: str) -> str:
result = model(sentence)
return result[0].get('label')
model = pipeline('sentiment-analysis')
print(get_sentiment(model, 'This is really great!'))
print(get_sentiment(model, 'Oh no! Thats horrible!'))Include get_sentiment (including the import statement) in a new script, question02.py script. Note that you do not have to use get_sentiment anywhere, just include it for now. Go to the terminal in RStudio and execute your script. What happens?
Remember, since our current shebang is #!/usr/bin/env python3, if our script uses one or more packages that are not installed in the current environment environment, the script will fail. This is what is happening. The transformers package that we use is not installed in the current environment. We do, however, have an environment that does have it installed, and it is located on Scholar at: /class/datamine/apps/python/pytorch2021/env/bin/python. Update the script's shebang and try to run it again. Does it work now?
Explanation: Depending on the state of your current environment, the original shebang, #!/usr/bin/env python3 will use the same Python interpreter and environment that is currently set to python3 (run which python3 to see). If you haven't run datamine_py, this will be something like: /apps/spack/scholar/fall20/apps/anaconda/2020.11-py38-gcc-4.8.5-djkvkvk/bin/python or /usr/bin/python, if you have run datamine_py, this will be: /class/datamine/apps/python/f2020-s2021/env/bin/python. Both environments lack the transformers package. Our other environment whose interpreter lives here: /class/datamine/apps/python/pytorch2021/env/bin/python does have this package. The shebang is then critically important for any scripts that want to utilize packages from a specific environment.
Important note: You can run bash code using a bash code chunk just like you would an R or Python code chunk. Simply replace "python" with "bash" in the code chunk options.
Relevant topics: writing scripts
Item(s) to submit:
- Sentence explaining why or why not the output from question (1) was expected.
-
Sentence explaining what happens when you include
get_sentimentin your script and try to execute it. - The entirety of the updated (working) script's content in a Python code chunk with chunk option "eval=F".
3. Okay, great. We now understand that if we want to use packages from a specific environment, we need to modify our shebang accordingly. As it currently stands, our script is pretty useless. Modify the script, in a new script called question03.py to accept a single argument. This argument should be a sentence. Your script should then print the sentence, and whether or not the sentence is "POSITIVE" or "NEGATIVE". Use sys.argv to accomplish this. Make sure the script functions in the following way:
$HOME/question03.py This is a happy sentence, yay!Too many arguments.$HOME/question03.py 'This is a happy sentence, yay!'Our sentence is: This is a happy sentence, yay!
POSITIVE$HOME/question03.py./question03.py requires at least 1 argument, "sentence".Hint: One really useful way to exit the script and print a message is like this:
import sys
sys.exit(f"{__file__} requires at least 1 argument, 'sentence'")Important note: You can run bash code using a bash code chunk just like you would an R or Python code chunk. Simply replace "python" with "bash" in the code chunk options.
Relevant topics: writing scripts
Item(s) to submit:
- The entirety of the updated (working) script's content in a Python code chunk with chunk option "eval=F".
- Output from running your script with the given examples.
4. If you look at the man pages for a command line tool like awk or grep (you can get these by running man awk or man grep in the terminal), you will see that typically CLI's have a variety of options. Options usually follow the following format:
grep -i 'ok' some_file.txtHowever, often times you have 2 ways you can use an option -- either with the short form (for example -i), or long form (for example -i is the same as --ignore-case). Sometimes options can get values. If options don't have values, you can assume that the presence of the flag means TRUE and the lack means FALSE. When using short form, the value for the option is separated by a space (for example grep -f my_file.txt). When using long form, the value for the option is separated by an equals sign (for example grep --file=my_file.txt).
Modify your script (as a new question04.py) to include an option called score. When active (question04.py --score or question04.py -s), the script should return both the sentiment, "POSITIVE" or "NEGATIVE" and the probability of being accurate. Make sure that you modify your checks from question 3 to continue to work whenever we use --score or -s. Some examples below:
$HOME/question04.py 'This is a happy sentence, yay!'Our sentence is: This is a happy sentence, yay!
POSITIVE$HOME/question04.py --score 'This is a happy sentence, yay!'Our sentence is: This is a happy sentence, yay!
POSITIVE: 0.999848484992981$HOME/question04.py -s 'This is a happy sentence, yay!'Our sentence is: This is a happy sentence, yay!
POSITIVE: 0.999848484992981$HOME/question04.py 'This is a happy sentence, yay!' -sOur sentence is: This is a happy sentence, yay!
POSITIVE: 0.999848484992981$HOME/question04.py 'This is a happy sentence, yay!' --scoreOur sentence is: This is a happy sentence, yay!
POSITIVE: 0.999848484992981$HOME/question04.py 'This is a happy sentence, yay!' --valueUnknown option(s): ['--value']$HOME/question04.py 'This is a happy sentence, yay!' --value --scoreToo many arguments.$HOME/question04.pyquestion04.py requires at least 1 argument, "sentence"$HOME/question04.py --score./question04.py requires at least 1 argument, "sentence". No sentence provided.$HOME/question04.py 'This is one sentence' 'This is another'./question04.py requires only 1 sentence, but 2 were provided.Important note: You can run bash code using a bash code chunk just like you would an R or Python code chunk. Simply replace "python" with "bash" in the code chunk options.
Hint: Experiment with the provided function. You will find the probability of being accurate is already returned by the model.
Relevant topics: writing scripts
Item(s) to submit:
- The entirety of the updated (working) script's content in a Python code chunk with chunk option "eval=F".
- Output from running your script with the given examples.
5. Wow, that is an extensive amount of logic for for a single option. Luckily, Python has the argparse package to help you build CLI's and handle situations like this. You can find the documentation for argparse here and a nice little tutorial here. Update your script (as a new question05.py) using argparse instead of custom logic. Specifically, add 1 positional argument called "sentence", and 1 optional argument "--score" or "-s". You should handle the following scenarios:
$HOME/question05.py 'This is a happy sentence, yay!'Our sentence is: This is a happy sentence, yay!
POSITIVE$HOME/question05.py --score 'This is a happy sentence, yay!'Our sentence is: This is a happy sentence, yay!
POSITIVE: 0.999848484992981$HOME/question05.py -s 'This is a happy sentence, yay!'Our sentence is: This is a happy sentence, yay!
POSITIVE: 0.999848484992981$HOME/question05.py 'This is a happy sentence, yay!' -sOur sentence is: This is a happy sentence, yay!
POSITIVE: 0.999848484992981$HOME/question05.py 'This is a happy sentence, yay!' --scoreOur sentence is: This is a happy sentence, yay!
POSITIVE: 0.999848484992981$HOME/question05.py 'This is a happy sentence, yay!' --valueusage: question05.py [-h] [-s] sentence
question05.py: error: unrecognized arguments: --value$HOME/question05.py 'This is a happy sentence, yay!' --value --scoreusage: question05.py [-h] [-s] sentence
question05.py: error: unrecognized arguments: --value$HOME/question05.pyusage: question05.py [-h] [-s] sentence
positional arguments:
sentence
optional arguments:
-h, --help show this help message and exit
-s, --score display the probability of accuracy$HOME/question05.py --scoreusage: question05.py [-h] [-s] sentence
question05.py: error: too few arguments$HOME/question05.py 'This is one sentence' 'This is another'usage: question05.py [-h] [-s] sentence
question05.py: error: unrecognized arguments: This is anotherHint: A good way to print the help information if no arguments are provided is:
if len(sys.argv) == 1:
parser.print_help()
parser.exit()Important note: Include the bash code chunk option error=T to enable RMarkdown to knit and output errors.
Important note: You can run bash code using a bash code chunk just like you would an R or Python code chunk. Simply replace "python" with "bash" in the code chunk options.
Relevant topics: writing scripts, argparse
Item(s) to submit:
- Python code used to solve the problem.
- Output from running your code.
Project 9
Motivation: In the previous project you worked through some common logic needed to make a good script. By the end of the project argparse was (hopefully) a welcome package to be able to use. In this project, we are going to continue to learn about argparse and create a CLI for the WHIN Data Portal. In doing so, not only will we get to practice using argparse, but you will also get to learn about using an API to retrieve data. An API (application programming interface) is a common way to retrieve structured data from a company or resource. It is common for large companies like Twitter, Facebook, Google, etc. to make certain data available via API's, so it is important to get some exposure.
Context: This is the second (of two) projects where we will learn about creating and using Python scripts.
Scope: python
Learning objectives:
- Write a python script that accepts user inputs and returns something useful.
- Interact with an API to retrieve data.
Make sure to read about, and use the template found here, and the important information about projects submissions here.
Dataset
The following questions will involve retrieving data using an API. Instructions and hints will be provided as we go.
Questions
1. WHIN (Wabash Heartland Innovation Network) has deployed hundreds of weather stations across the region so farmers can use the data collected to become more efficient, save time, and increase yields. WHIN has kindly granted access to 20+ public-facing weather stations for educational purposes.
Navigate to https://data.whin.org/data/current-conditions, and click on the "CREATE ACCOUNT" button in the middle of the screen:
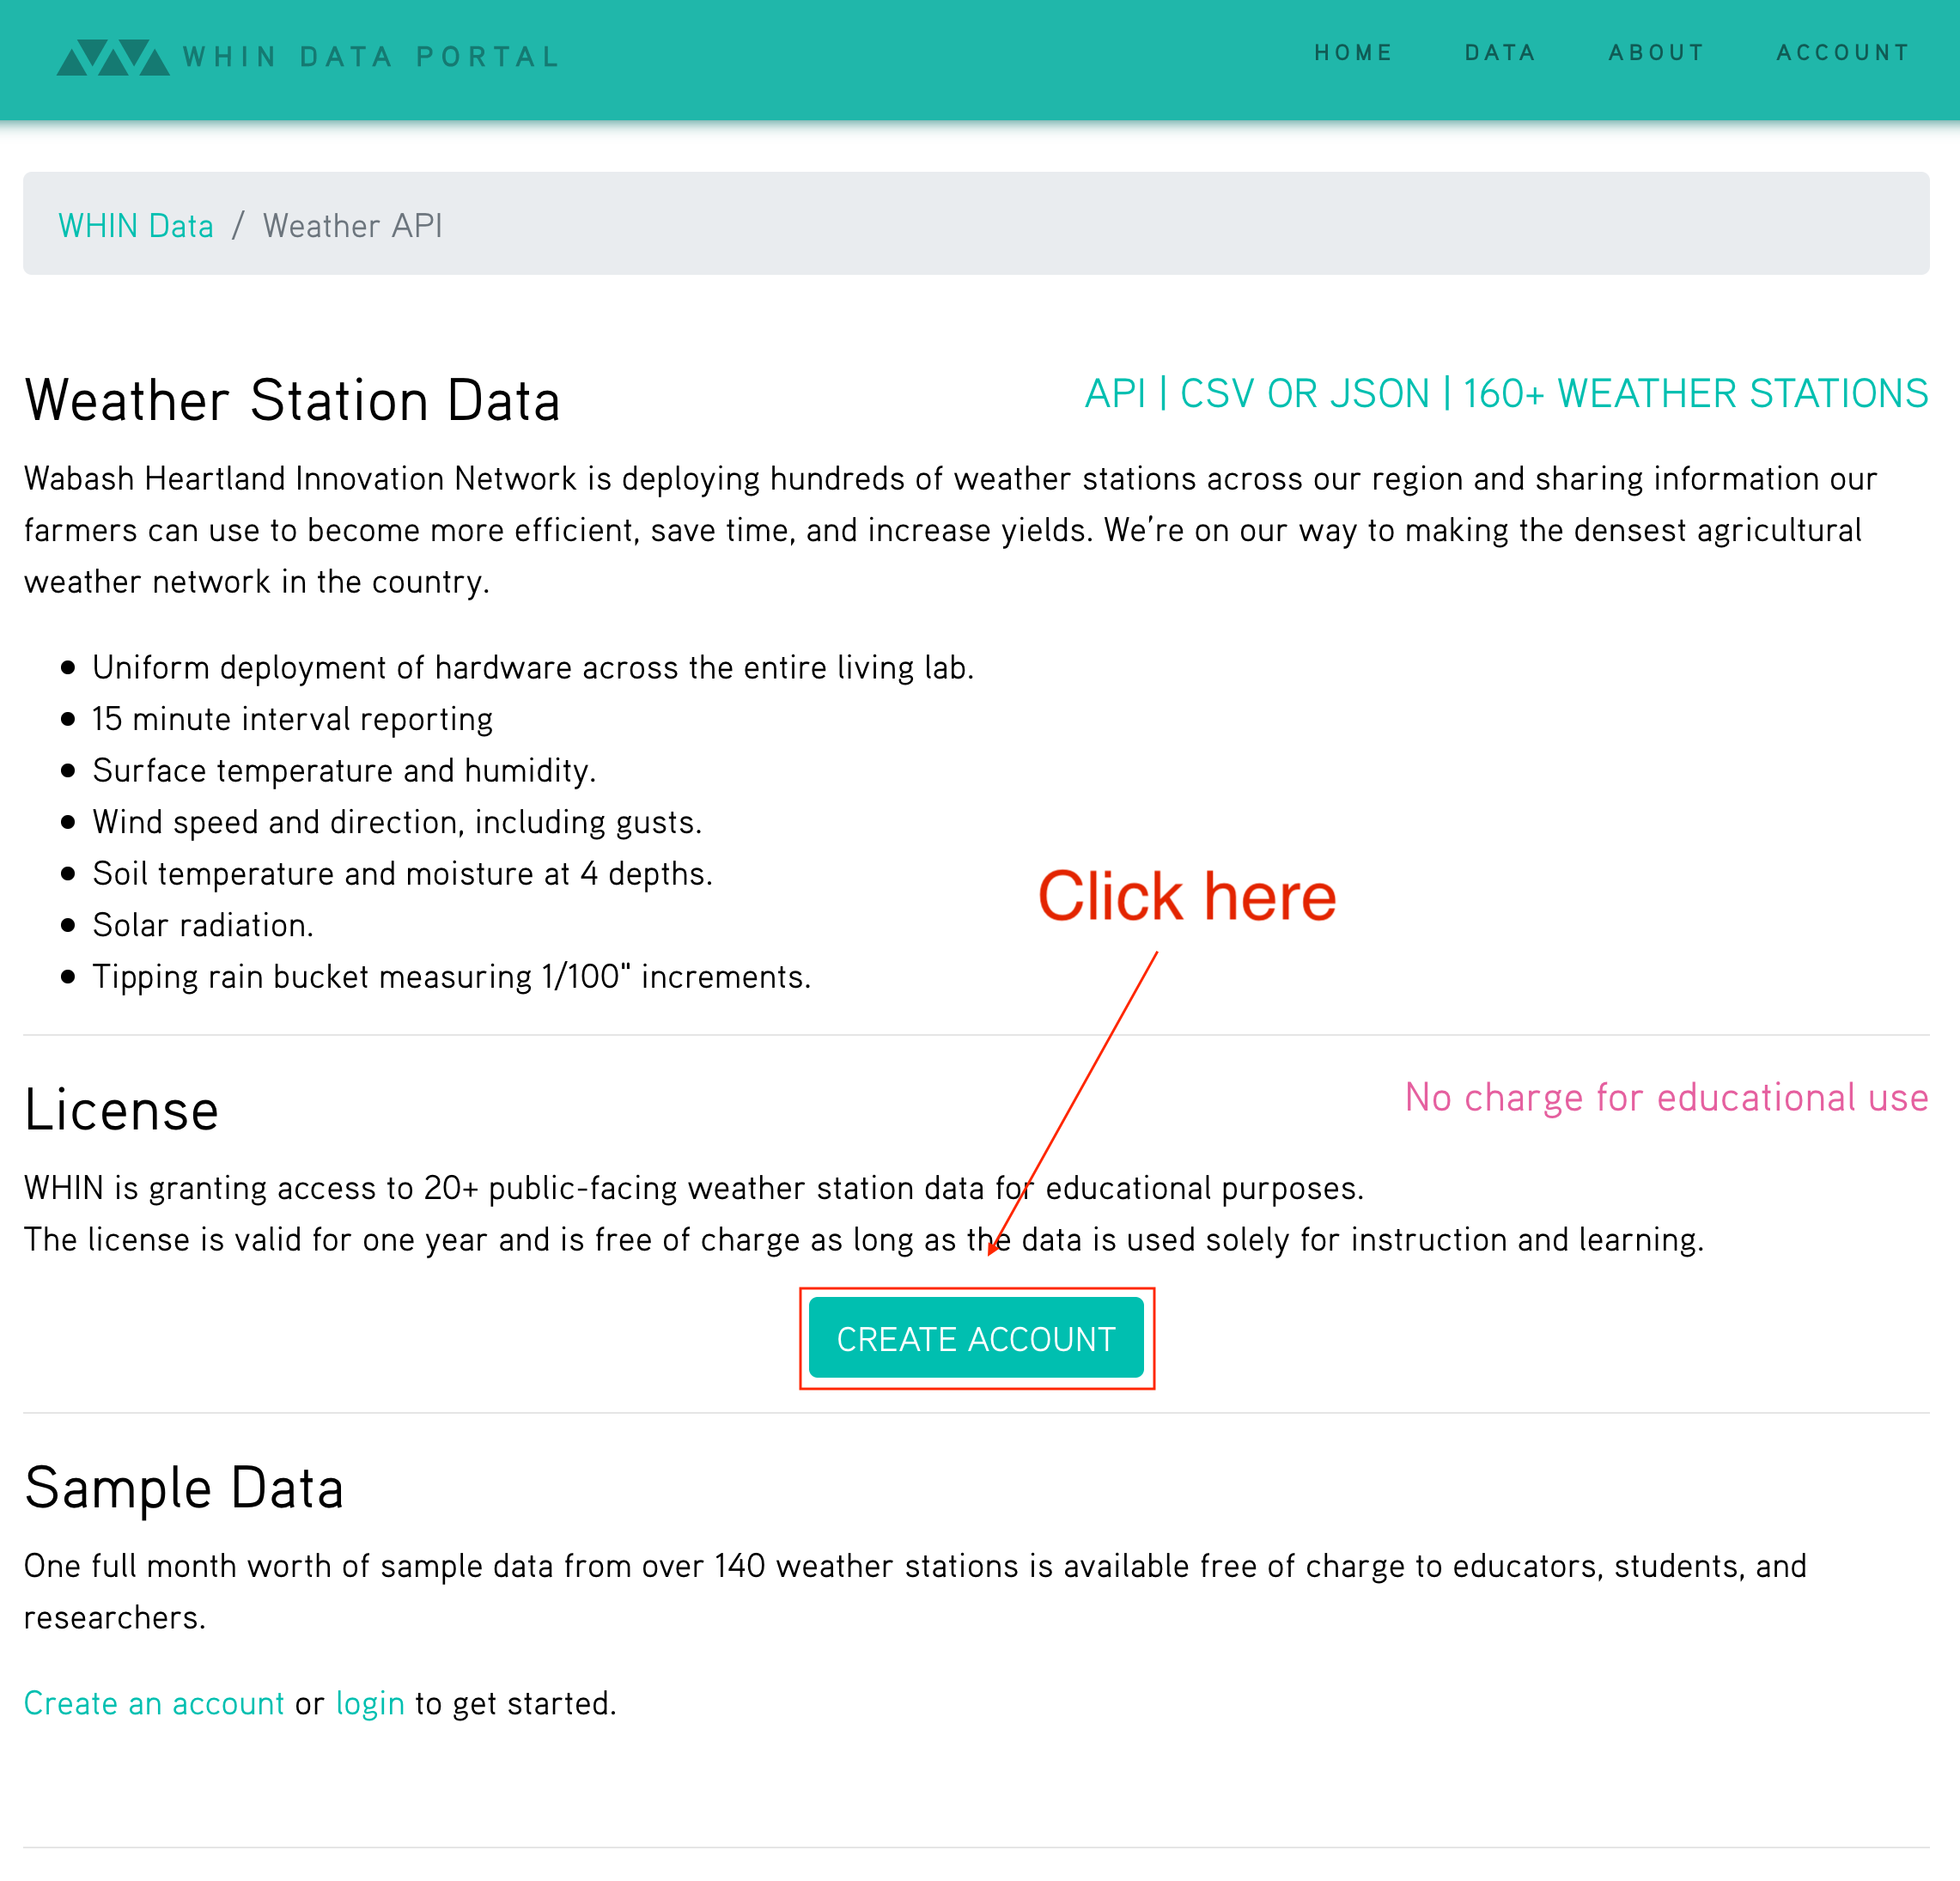
Click on "I'm a student or educator":
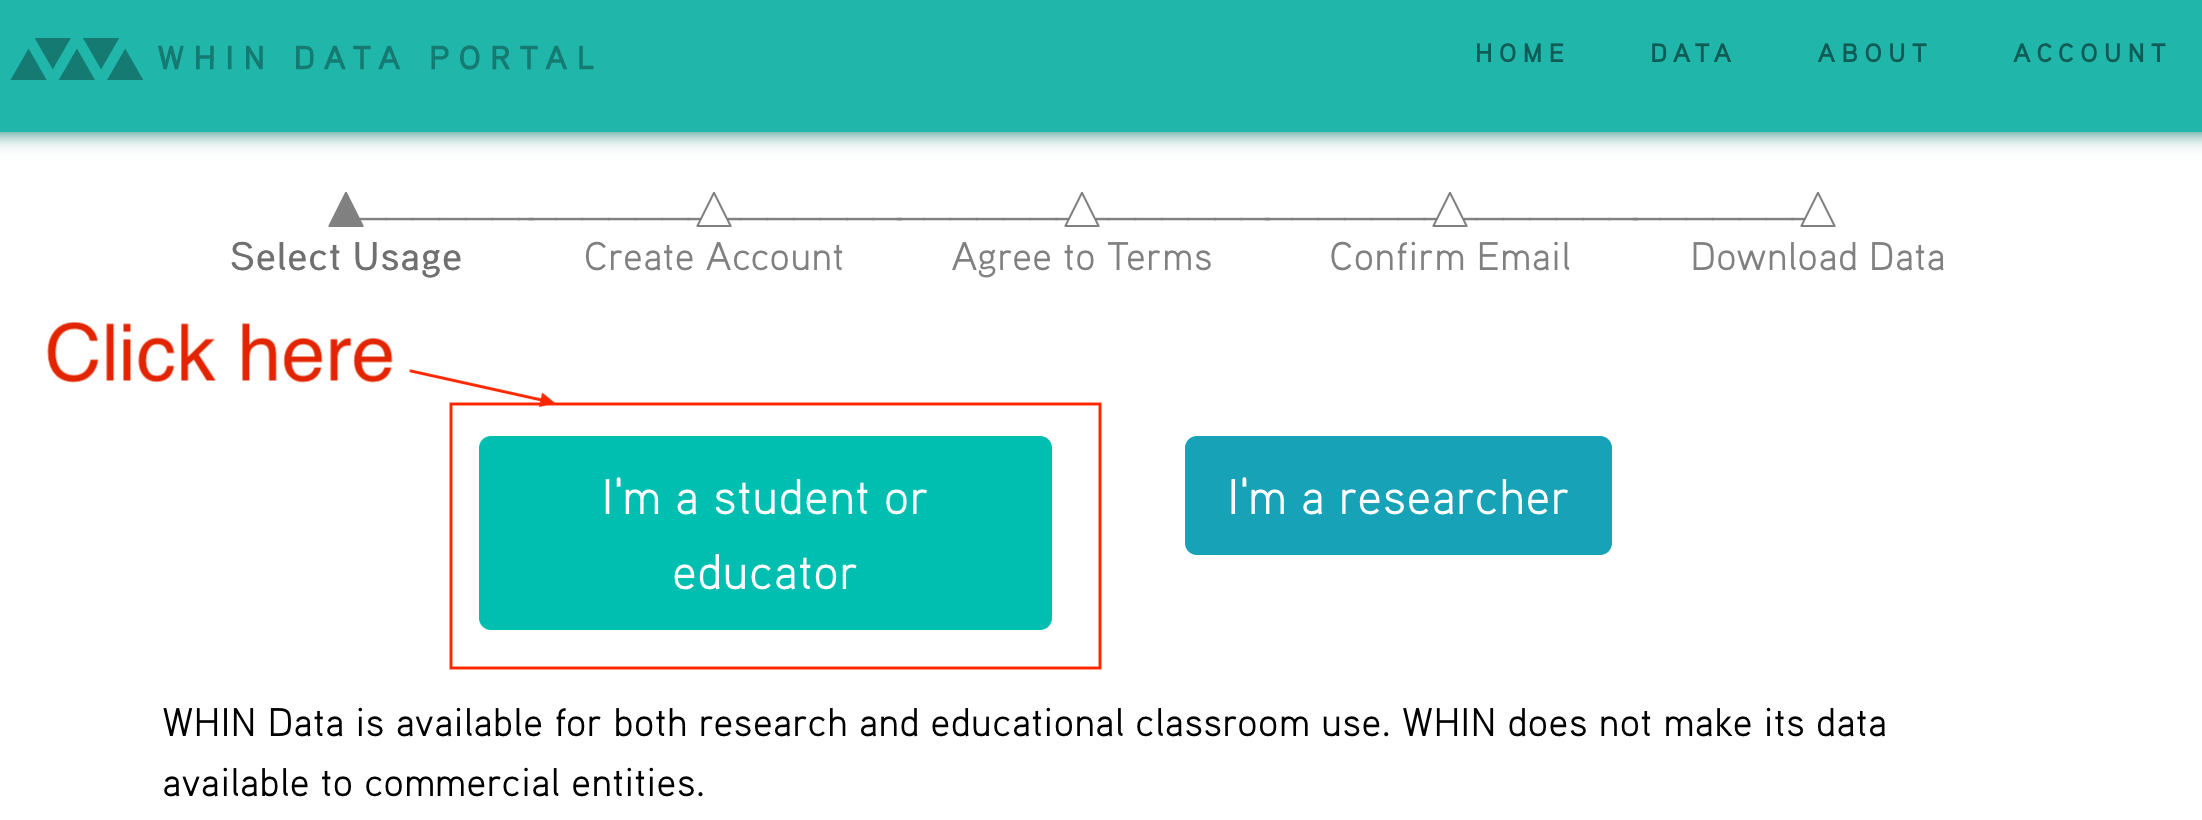
Enter your information. For "School or Organization" please enter "Purdue University". For "Class or project", please put "The Data Mine Project 9". For the description, please put "We are learning about writing scripts by writing a CLI to fetch data from the WHIN API." Please use your purdue.edu email address. Once complete, click "Next".
Read about the API under "API Usage". An endpoint is the place (in this case the end of a URL (which can be referred to as the URI)) that you can use to access/delete/update/etc. a given resource depending on the HTTP method used. What are the 3 endpoints of this API?
Write and run a script called question01.py that, when run, tries to print the current listing of the weather stations. Instead of printing what you think it should print, it will print something else. What happened?
$HOME/question01.pyHint: You can use the requests library to run the HTTP GET method on the endpoint. For example:
import requests
response = requests.get("https://datamine.purdue.edu/")
print(response.json())Hint: We want to use our regular course environment, therefore, make sure to use the following shebang: #!/class/datamine/apps/python/f2020-s2021/env/bin/python
Relevant topics: writing scripts
Item(s) to submit:
- List the 3 endpoints for this API.
- The entirety of the updated (working) script's content in a Python code chunk with chunk option "eval=F".
- Output from running your script with the given examples.
Update your script (as a new script called question02.py), and test it out again to see if we get the expected results now. question02.py should only print the first 5 results.
A couple important notes:
- The bearer token should be taken care of like a password. You do NOT want to share this, ever.
- There is an inherent risk in saving code like the code shown above. What if you accidentally upload it to GitHub? Then anyone with access could potentially read and use your token.
In this file, replace the "aslgdkj..." part with you actual token and save the file. Then make sure only YOU can read and write to this file by running the following in a terminal:
chmod 600 $HOME/.envNow, we can use a package called dotenv to load the variables in the $HOME/.env file into the environment. We can then use the os package to get the environment variables. For example:
import os
from dotenv import load_dotenv
# This function will load the .env file variables from the same directory as the script into the environment
load_dotenv()
# We can now use os.getenv to get the important information without showing anything.
# Now, all anybody reading the code sees is "os.getenv('MY_BEARER_TOKEN')" even though that is replaced by the actual
# token when the code is run, cool!
my_headers = {"Authorization": f"Bearer {os.getenv('MY_BEARER_TOKEN')}"}Update question02.py to use dotenv and os.getenv to get the token from the local $HOME/.env file. Test out your script:
$HOME/question02.py Relevant topics: writing scripts
Item(s) to submit:
- The entirety of the updated (working) script's content in a Python code chunk with chunk option "eval=F".
- Output from running your script with the given example.
3. That's not so bad! We now know how to retrieve data from the API as well as load up variables from our environment rather than insecurely just pasting them in our code, great!
A query parameter is (more or less) some extra information added at the end of the endpoint. For example, the following url has a query parameter called param and value called value: https://example.com/some_resource?param=value. You could even add more than one query parameter as follows: https://example.com/some_resource?param=value&second_param=second_value -- as you can see, now we have another parameter called second_param with a value of second_value. While the query parameters begin with a ?, each subsequent parameter is added using &.
Query parameters can be optional or required. API's will sometimes utilize query parameters to filter or fine-tune the returned results. Look at the documentation for the /api/weather/station-daily endpoint. Use your newfound knowledge of query parameters to update your script (as a new script called question03.py) to retrieve the data for station with id 150 on 2021-01-05, and print the first 5 results. Test out your script:
$HOME/question03.pyRelevant topics: writing scripts
Item(s) to submit:
- The entirety of the updated (working) script's content in a Python code chunk with chunk option "eval=F".
- Output from running your script with the given example.
4. Excellent, now let's build our CLI. Call the script whin.py. Use your knowledge of requests, argparse, and API's to write a CLI that replicates the behavior shown below. For convenience, only print the first 2 results for all output.
Hints:
- In general, there will be 3 commands:
stations,daily, andcc(for current condition). - You will want to create a subparser for each command:
stations_parser,current_conditions_parser, anddaily_parser. - The
daily_parserwill have 2 position, required arguments:station_idanddate. - The
current_conditions_parserwill have 2 optional arguments of typestr:--center/-cand--radius/-r. - If only one of
--centeror--radiusis present, you should usesys.exitto print a message saying "Need both center AND radius, or neither.". - To create a subparser, just do the following:
parser = argparse.ArgumentParser()
subparsers = parser.add_subparsers(help="possible commands", dest="command")
my_subparser = subparsers.add_parser("my_command", help="my help message")
my_subparser.add_argument("--my-option", type=str, help="some option")
args = parser.parse_args()- Then, you can access which command was run with
args.command(which in this case would only have 1 possible value ofmy_command), and access any parser or subparsers options withargs, for example,args.my_option.
$HOME/whin.pyusage: whin.py [-h] {stations,cc,daily} ...
positional arguments:
{stations,cc,daily} possible commands
stations list the stations
cc list the most recent data from each weather station
daily list data from a given day and station
optional arguments:
-h, --help show this help message and exitHint: A good way to print the help information if no arguments are provided is:
if len(sys.argv) == 1:
parser.print_help()
parser.exit()$HOME/whin.py stations -husage: whin.py stations [-h]
optional arguments:
-h, --help show this help message and exit$HOME/whin.py cc -husage: whin.py cc [-h] [-c CENTER] [-r RADIUS]
optional arguments:
-h, --help show this help message and exit
-c CENTER, --center CENTER
return results near this center coordinate, given as a
latitude,longitude pair
-r RADIUS, --radius RADIUS
search distance, in meters, from the center$HOME/whin.py cc[{'humidity': 90, 'latitude': 40.93894, 'longitude': -86.47418, 'name': 'WHIN001-PULA001', 'observation_time': '2021-03-16T18:45:00Z', 'pressure': '30.051', 'rain': '0', 'rain_inches_last_hour': '0', 'soil_moist_1': 6, 'soil_moist_2': 11, 'soil_moist_3': 14, 'soil_moist_4': 9, 'soil_temp_1': 42, 'soil_temp_2': 40, 'soil_temp_3': 40, 'soil_temp_4': 41, 'solar_radiation': 203, 'solar_radiation_high': 244, 'station_id': 1, 'temperature': 40, 'temperature_high': 40, 'temperature_low': 40, 'wind_direction_degrees': '337.5', 'wind_gust_direction_degrees': '22.5', 'wind_gust_speed_mph': 6, 'wind_speed_mph': 3}, {'humidity': 88, 'latitude': 40.73083, 'longitude': -86.98467, 'name': 'WHIN003-WHIT001', 'observation_time': '2021-03-16T18:45:00Z', 'pressure': '30.051', 'rain': '0', 'rain_inches_last_hour': '0', 'soil_moist_1': 6, 'soil_moist_2': 5, 'soil_moist_3': 6, 'soil_moist_4': 4, 'soil_temp_1': 40, 'soil_temp_2': 39, 'soil_temp_3': 39, 'soil_temp_4': 40, 'solar_radiation': 156, 'solar_radiation_high': 171, 'station_id': 3, 'temperature': 40, 'temperature_high': 40, 'temperature_low': 39, 'wind_direction_degrees': '337.5', 'wind_gust_direction_degrees': '337.5', 'wind_gust_speed_mph': 8, 'wind_speed_mph': 3}]Important note: Your values may be different because they are current conditions.
$HOME/whin.py cc --radius=10000Need both center AND radius, or neither.$HOME/whin.py cc --center=40.4258686,-86.9080654Need both center AND radius, or neither.$HOME/whin.py cc --center=40.4258686,-86.9080654 --radius=10000[{'humidity': 86, 'latitude': 40.42919, 'longitude': -86.84547, 'name': 'WHIN008-TIPP005 Chatham Square', 'observation_time': '2021-03-16T18:45:00Z', 'pressure': '30.012', 'rain': '0', 'rain_inches_last_hour': '0', 'soil_moist_1': 5, 'soil_moist_2': 5, 'soil_moist_3': 5, 'soil_moist_4': 5, 'soil_temp_1': 42, 'soil_temp_2': 41, 'soil_temp_3': 41, 'soil_temp_4': 42, 'solar_radiation': 191, 'solar_radiation_high': 220, 'station_id': 8, 'temperature': 42, 'temperature_high': 42, 'temperature_low': 42, 'wind_direction_degrees': '0', 'wind_gust_direction_degrees': '22.5', 'wind_gust_speed_mph': 9, 'wind_speed_mph': 3}, {'humidity': 86, 'latitude': 40.38494, 'longitude': -86.84577, 'name': 'WHIN027-TIPP003 EXT', 'observation_time': '2021-03-16T18:45:00Z', 'pressure': '29.515', 'rain': '0', 'rain_inches_last_hour': '0', 'soil_moist_1': 5, 'soil_moist_2': 4, 'soil_moist_3': 4, 'soil_moist_4': 5, 'soil_temp_1': 43, 'soil_temp_2': 42, 'soil_temp_3': 42, 'soil_temp_4': 42, 'solar_radiation': 221, 'solar_radiation_high': 244, 'station_id': 27, 'temperature': 43, 'temperature_high': 43, 'temperature_low': 43, 'wind_direction_degrees': '337.5', 'wind_gust_direction_degrees': '337.5', 'wind_gust_speed_mph': 6, 'wind_speed_mph': 3}]$HOME/whin.py dailyusage: whin.py daily [-h] station_id date
whin.py daily: error: too few arguments$HOME/whin.py daily 150 2021-01-05[{'humidity': 96, 'latitude': 41.00467, 'longitude': -86.68428, 'name': 'WHIN058-PULA007', 'observation_time': '2021-01-05T05:00:00Z', 'pressure': '29.213', 'rain': '0', 'rain_inches_last_hour': '0', 'soil_moist_1': 5, 'soil_moist_2': 6, 'soil_moist_3': 7, 'soil_moist_4': 5, 'soil_temp_1': 33, 'soil_temp_2': 34, 'soil_temp_3': 35, 'soil_temp_4': 35, 'solar_radiation': 0, 'solar_radiation_high': 0, 'station_id': 150, 'temperature': 31, 'temperature_high': 31, 'temperature_low': 31, 'wind_direction_degrees': '270', 'wind_gust_direction_degrees': '292.5', 'wind_gust_speed_mph': 13, 'wind_speed_mph': 8}, {'humidity': 96, 'latitude': 41.00467, 'longitude': -86.68428, 'name': 'WHIN058-PULA007', 'observation_time': '2021-01-05T05:15:00Z', 'pressure': '29.207', 'rain': '1', 'rain_inches_last_hour': '0', 'soil_moist_1': 5, 'soil_moist_2': 6, 'soil_moist_3': 7, 'soil_moist_4': 5, 'soil_temp_1': 33, 'soil_temp_2': 34, 'soil_temp_3': 35, 'soil_temp_4': 35, 'solar_radiation': 0, 'solar_radiation_high': 0, 'station_id': 150, 'temperature': 31, 'temperature_high': 31, 'temperature_low': 31, 'wind_direction_degrees': '270', 'wind_gust_direction_degrees': '292.5', 'wind_gust_speed_mph': 14, 'wind_speed_mph': 9}]Relevant topics: writing scripts
Item(s) to submit:
- The entirety of the updated (working) script's content in a Python code chunk with chunk option "eval=F".
- Output from running your script with the given examples.
5. There are a multitude of improvements and/or features that we could add to whin.py. Customize your script (as a new script called question05.py), to either do something new, or fix a scenario that wasn't covered in question 4. Be sure to include 1-2 sentences that explains exactly what your modification does. Demonstrate the feature by running it in a bash code chunk.
Relevant topics: writing scripts
Item(s) to submit:
- The entirety of the updated (working) script's content in a Python code chunk with chunk option "eval=F".
- Output from running your script with the given examples.
Project 10
Motivation: The use of a suite of packages referred to as the tidyverse is popular with many R users. It is apparent just by looking at tidyverse R code, that it varies greatly in style from typical R code. It is useful to gain some familiarity with this collection of packages, in case you run into a situation where these packages are needed -- you may even find that you enjoy using them!
Context: We've covered a lot of ground so far this semester, and almost completely using Python. In this next series of projects we are going to switch back to R with a strong focus on the tidyverse (including ggplot) and data wrangling tasks.
Scope: R, tidyverse, ggplot
Learning objectives:
- Explain the differences between regular data frames and tibbles.
- Use mutate, pivot, unite, filter, and arrange to wrangle data and solve data-driven problems.
- Combine different data using joins (left_join, right_join, semi_join, anti_join), and bind_rows.
- Group data and calculate aggregated statistics using group_by, mutate, and transform functions.
-
Demonstrate the ability to create basic graphs with default settings, in
ggplot. - Demonstrate the ability to modify axes labels and titles.
Make sure to read about, and use the template found here, and the important information about projects submissions here.
The tidyverse consists of a variety of packages, including, but not limited to: ggplot2, dplyr, tidyr, readr, purrr, tibble, stringr, and lubridate.
One of the underlying premises of the tidyverse is getting the data to be tidy. You can read a lot more about this in Hadley Wickham's excellent book, R for Data Science.
There is an excellent graphic here that illustrates a general workflow for data science projects:
- Import
- Tidy
- Iterate on, to gain understanding:
- Transform
- Visualize
- Model
- Communicate
This is a good general outline of how a project could be organized, but depending on the project or company, this could vary greatly and change as the goals of a project change.
Dataset
The following questions will use the dataset found in Scholar:
/class/datamine/data/okcupid/filtered/*.csv
Questions
1. Let's (more or less) follow the guidelines given above. The first step is to import the data. There are two files: questions.csv, and users.csv. Read this section, and use what you learn to read in the two files into questions and users, respectively. Which functions from the tidyverse did you use and why?
Hint: Its easy to load up the tidyverse packages:
library(tidyverse)Hint: Just because a file has the .csv extension does not mean that is it comma separated.
Hint: Make sure to print the tibbles after reading them in to ensure that they were read in correctly. If they were not, use a different function (from tidyverse) to read in the data.
Hint: questions should be 2281x10 and users should be 68371 x 2284
Item(s) to submit:
- R code used to solve the problem.
-
headof each dataset,usersandquestions. -
1 sentence explaining which functions you used (from
tidyverse) and why.
2. You may recall that the function read.csv from base R reads data into a data.frame by default. In the tidyverse, readr's functions read the data into a tibble's, instead. Read this section. To summarize, some important features that are true for tibble's but not necessarily for data.frames are:
- Non-syntactic variable names (surrounded by backticks
`) - Never changes the type of the inputs (for example converting strings to factors)
- More informative output from printing
- No partial matching
- Simple subsetting
Great, the next step in our outline is to make the data "tidy". Read this section. Okay, let's say, for instance, that we wanted to create a tibble with the following columns: user, question, question_text, selected_option, race, gender2, gender_orientation, n, and keywords. As you can imagine, the "tidy" format, while great for analysis, would not be great for storage as there would be a row for each question for each user, at least. Columns like gender2 and race don't change for a user, so we end up with a lot of repeated values.
Okay, we don't need to analyze all 68000 users at once, let's instead, take a random sample of 2200 users, and create a "tidy" tibble as described above. After all, we want to see why this format is useful! While trying to figure out how to do this may seem daunting at first, it is actually not so bad:
First, we convert the users tibble to long form, so each row represents 1 answer to 1 questions from 1 user:
# Add an "id" columns to the users data
users$id <- 1:nrow(users)
# To ensure we get the same random sample, run the set.seed line
# before every time you run the following line
set.seed(12345)
columns_to_pivot <- 1:2278
users_sample_long <- users[sample(nrow(users), 2200),] %>%
mutate_at(columns_to_pivot, as.character) %>% # This converts all of our columns in columns_to_pivot to strings
pivot_longer(cols = columns_to_pivot, names_to="question", values_to = "selected_option") # The old qXXXX columns are now values in the "question" column.Next, we want to merge our data from the questions tibble with our users_sample_long tibble, into a new table we will call myDF. How many rows and columns are in myDF?
myDF <- merge(users_sample_long, questions, by.x = "question", by.y = "X")Challenge: (0 pts, for fun) If you are looking for a challenge, try to do this in excel or without tidyverse.
Item(s) to submit:
- R code used to solve the problem.
-
The number of rows and columns in
myDF. -
The
headofmyDF.
3. Excellent! Now, we have a nice tidy dataset that we can work with. You may have noticed some odd syntax %>% in the code provided in the previous question. %>% is the piping operator in R added by the magittr package. It works pretty much just like | does in bash. It "feeds" the output from the previous bit of code to the next bit of code. It is extremely common practice to use this operator in the tidyverse.
Observe the head of myDF. Notice how our question column has the value d_age, text has the content "Age", and selected_option (the column that shows the "answer" the user gave), has the actual age of the user. Wouldn't it be better if our myDF had a new column called age instead of age being an answer to a question?
Modify the code provided in question 2 so age ends up being a column in myDF with the value being the actual age of the user.
Hint: Pay close attention to pivot_longer. You will need to understand what this function is doing to fix this.
Hint: You can make a single modification to 1 line to accomplish this. Pay close attention to the cols option in pivot_longer. If you include a column in cols what happens? If you exclude a columns from cols what happens? Experiment on the following tibble, using different values for cols, as well as names_to, and values_to:
myDF <- tibble(
x=1:3,
y=1,
question1=c("How", "What", "Why"),
question2=c("Really", "You sure", "When"),
question3=c("Who", "Seriously", "Right now")
)Challenge: (0 pts, for fun) If you are looking for a challenge, try to do this in excel or without tidyverse.
Relevant topics: Negative Indexing, which
Item(s) to submit:
- R code used to solve the problem.
-
The number of rows and columns in
myDF. -
The
headofmyDF.
4. Wow! That is pretty powerful! Okay, it is clear that there are question questions, where the column starts with "q", and other questions, where the column starts with something else. Modify question (3) so all of the questions that don't start with "q" have their own column in myDF. Like before, show the number of rows and columns for the new myDF, as well as print the head.
Challenge: (0 pts, for fun) If you are looking for a challenge, try to do this in excel or without tidyverse.
Relevant topics: Negative Indexing, which
Item(s) to submit:
- R code used to solve the problem.
-
The number of rows and columns in
myDF. -
The
headofmyDF.
5. It seems like we've spent the majority of the project just wrangling our dataset -- that is normal! You'd be incredibly lucky to work in an environment where you recieve data in a nice, neat, perfect format. Let's do a couple basic operations now, to practice.
mutate is a powerful function in dplyr, that is not easy to mimic in Python's pandas package. mutate adds new columns to your tibble, while preserving your existing columns. It doesn't sound very powerful, but it is.
Use mutate to create a new column called generation. generation should contain "Gen Z" for ages [0, 24], "Millenial" for ages [25-40], "Gen X" for ages [41-56], and "Boomers II" for ages [57-66], and "Older" for all other ages.
Relevant topics: mutate, case_when, between
Item(s) to submit:
- R code used to solve the problem.
-
The number of rows and columns in
myDF. -
The
headofmyDF.
6. Use ggplot to create a scatterplot showing d_age on the x-axis, and lf_min_age on the y-axis. lf_min_age is the minimum age a user is okay dating. Color the points based on gender2. Add a proper title, and labels for the X and Y axes. Use alpha=.6.
Note: This may take quite a few minutes to create. Before creating a plot with the entire myDF, use myDF[1:10,]. If you are in a time crunch, the minimum number of points to plot to get full credit is 100, but if you wait, the plot is a bit more telling.
Relevant topics: ggplot
Item(s) to submit:
- R code used to solve the problem.
- Output from running your code.
- The plot produced.
Project 11
Motivation: Data wrangling is the process of gathering, cleaning, structuring, and transforming data. Data wrangling is a big part in any data driven project, and sometimes can take a great deal of time. tidyverse is a great, but opinionated, suite of integrated packages to wrangle, tidy and visualize data. It is useful to gain some familiarity with this collection of packages, in case you run into a situation where these packages are needed -- you may even find that you enjoy using them!
Context: We have covered a few topics on the tidyverse packages, but there is a lot more to learn! We will continue our strong focus on the tidyverse (including ggplot) and data wrangling tasks.
Scope: R, tidyverse, ggplot
Learning objectives:
- Explain the differences between regular data frames and tibbles.
- Use mutate, pivot, unite, filter, and arrange to wrangle data and solve data-driven problems.
- Combine different data using joins (left_join, right_join, semi_join, anti_join), and bind_rows.
- Group data and calculate aggregated statistics using group_by, mutate, and transform functions.
-
Demonstrate the ability to create basic graphs with default settings, in
ggplot. - Demonstrate the ability to modify axes labels and titles.
Make sure to read about, and use the template found here, and the important information about projects submissions here.
The tidyverse consists of a variety of packages, including, but not limited to: ggplot2, dplyr, tidyr, readr, purrr, tibble, stringr, and lubridate.
One of the underlying premises of the tidyverse is getting the data to be tidy. You can read a lot more about this in Hadley Wickham's excellent book, R for Data Science.
There is an excellent graphic here that illustrates a general workflow for data science projects:
- Import
- Tidy
- Iterate on, to gain understanding:
- Transform
- Visualize
- Model
- Communicate
This is a good general outline of how a project could be organized, but depending on the project or company, this could vary greatly and change as the goals of a project change.
Dataset
The following questions will use the dataset found in Scholar:
/class/datamine/data/okcupid/filtered/*.csv
Questions
datamine_py()
library(tidyverse)
questions <- read_csv2("/class/datamine/data/okcupid/filtered/questions.csv")
users <- read_csv("/class/datamine/data/okcupid/filtered/users.csv")users$id <- 1:nrow(users)
set.seed(12345)
columns_to_pivot <- 1:2278
users_sample_long <- users[sample(nrow(users), 2200),] %>%
mutate_at(columns_to_pivot, as.character) %>%
pivot_longer(cols = columns_to_pivot, names_to="question", values_to = "selected_option")
myDF <- merge(users_sample_long, questions, by.x = "question", by.y = "X")users$id <- 1:nrow(users)
set.seed(12345)
columns_to_pivot <- 1:2278
users_sample_long <- users[sample(nrow(users), 2200),] %>%
mutate_at(columns_to_pivot, as.character) %>%
pivot_longer(cols = columns_to_pivot[-1242], names_to="question", values_to = "selected_option")
myDF <- merge(users_sample_long, questions, by.x = "question", by.y = "X")users$id <- 1:nrow(users)
set.seed(12345)
columns_to_pivot <- 1:2278
users_sample_long <- users[sample(nrow(users), 2200),] %>%
mutate_at(columns_to_pivot, as.character) %>%
pivot_longer(cols = columns_to_pivot[-(which(substr(names(users), 1, 1) != "q"))], names_to="question", values_to = "selected_option")
myDF <- merge(users_sample_long, questions, by.x = "question", by.y = "X")myDF <- myDF %>% mutate(generation=case_when(d_age<=24 ~ "Gen Z",
between(d_age, 25, 40) ~ "Millenial",
between(d_age, 41, 56) ~ "Gen X",
between(d_age, 57, 66) ~ "Boomers II",
TRUE ~ "Other"))ggplot(myDF[1:100,]) +
geom_point(aes(x=d_age, y = lf_min_age, col=gender2), alpha=.6) +
labs(title="Minimum dating age by gender", x="User age", y="Minimum date age")1. Let's pick up where we left in project 10. For those who struggled with project 10, I will post the solutions above either on Saturday morning, or at the latest Monday. Re-run your code from project 10 so we, once again, have our tibble, myDF.
At the end of project 10 we created a scatterplot showing d_age on the x-axis, and lf_min_age on the y-axis. In addition, we colored the points by gender2. In many cases, instead of just coloring the different dots, we may want to do the exact same plot for different groups. This can easily be accomplished using ggplot.
Without splitting or filtering your data prior to creating the plots, create a graphic with plots for each generation where we show d_age on the x-axis and lf_min_age on the y-axis, colored by gender2.
Important note: You do not need to modify myDF at all.
Important note: This may take quite a few minutes to create. Before creating a plot with the entire myDF, use myDF[1:50,]. If you are in a time crunch, the minimum number of points to plot to get full credit is 500, but if you wait, the plot is a bit more telling.
Relevant topics: facet_wrap, facet_grid
Item(s) to submit:
- R code used to solve the problem.
- Output from running your code.
- The plot produced.
2. By default, facet_wrap and facet_grid maintain the same scale for the x and y axes across the various plots. This makes it easier to compare visually. In this case, it may make it harder to see the patterns that emerge. Modify your code from question (1) to allow each facet to have its own x and y axis limits.
Hint: Look at the argument scales in the facet_wrap/facet_grid functions.
Relevant topics: facet_wrap, facet_grid
Item(s) to submit:
- R code used to solve the problem.
- Output from running your code.
- The plot produced.
3. Let's say we have a theory that the older generations tend to smoke more. You decided you want to create a plot that compares the percentage of smokers per generation. Before we do this, we need to wrangle the data a bit.
What are the possible values of d_smokes? Create a new column in myDF called is_smoker that has values TRUE, FALSE, or NA when applicable. You will need to determine how you will assign a user as a smoker or not -- this is up to you! Explain your cutoffs. Make sure you stay in the tidyverse to solve this problem.
Relevant topics: unique, mutate, case_when
Item(s) to submit:
- R code used to solve the problem.
- Output from running your code.
-
1-2 sentences explaining your logic and cutoffs for the new
is_smokercolumn. -
The
tableof theis_smokercolumn.
4. Great! Now that we have our new is_smoker column, create a new tibble called smokers_per_gen. smokers_per_gen should be a summary of myDF containing the percentage of smokers per generation.
Hint: The result, smokers_per_gen should have 2 columns: generation and percentage_of_smokers. It should have the same number of rows as there are generations.
Relevant topics: group_by, summarize
Item(s) to submit:
- R code used to solve the problem.
- Output from running your code.
5. Create a Cleveland dot plot using ggplot to show the percentage of smokers for the different generations. Use ggthemr to give your plot a new look! You can choose any theme you'd like!
Is our theory from question (3) correct? Explain why you think so, or not.
(OPTIONAL I, 0 points) To make the plot have a more aesthetic look, consider reordering the data by percentage of smokers, or even by the generation's age. You can do that before passing the data using the arrange function, or inside the geom_point function, using the reorder function. To re-order by generation, you can either use brute force, or you can create a new column called avg_age while using summarize. avg_age should be the average age for each group (using the variable d_age). You can use this new column, avg_age to re-order the data.
(OPTIONAL II, 0 points) Improve our plot, change the x-axis to be displayed as a percentage. You can use the scales package and the function scale_x_continuous to accomplish this.
Hint: Use geom_point not geom_dotplot to solve this problem.
Relevant topics: geom_point, ggthemr
Item(s) to submit:
- R code used to solve the problem.
- Output from running your code.
- The plot produced.
- 1-2 sentences commenting on the theory, and what are your conclusions based on your plot (if any).
Project 12
Motivation: As we mentioned before, data wrangling is a big part in any data driven project. "Data Scientists spend up to 80% of the time on data cleaning and 20 percent of their time on actual data analysis." Therefore, it is worth to spend some time mastering how to best tidy up our data.
Context: We are continuing to practice using various tidyverse packages, in order to wrangle data.
Scope: python
Learning objectives:
- Explain the differences between regular data frames and tibbles.
- Use mutate, pivot, unite, filter, and arrange to wrangle data and solve data-driven problems.
- Combine different data using joins (left_join, right_join, semi_join, anti_join), and bind_rows.
- Group data and calculate aggregated statistics using group_by, mutate, and transform functions.
-
Demonstrate the ability to create basic graphs with default settings, in
ggplot. - Demonstrate the ability to modify axes labels and titles.
Make sure to read about, and use the template found here, and the important information about projects submissions here.
The first step in any data science project is to define our problem statement. In this project, our goal is to gain insights into customers' behaviours with regards to online orders and restaurant ratings.
Dataset
The following questions will use the dataset found in Scholar:
/class/datamine/data/restaurant_recommendation/*.csv
Questions
1. Load the tidyverse suite a packages, and read the data from files orders.csv, train_customers.csv, and vendors.csv into tibbles named orders, customers, and vendors respectively.
Take a look the tibbles and describe in a few sentences the type of information contained in each dataset. Although the name can be self-explanatory, it is important to get an idea of what exactly we are looking at. For each combination of 2 datasets, which column would you use to join them?
Relevant topics: read_csv, str, glimpse, head
Item(s) to submit:
- R code used to solve the problem.
- Output from running your code.
-
1-2 sentences explaining each dataset (
orders,customers, andvendors). - 1-2 sentences for each combination of 2 datasets describing if we could combine the datasets or not, and which column you would you use to join them.
2. Let's tidy up our datasets a bit prior to joining them. For each dataset, complete the tasks below.
orders: remove columns from and betweenpreparationtimetodelivered_time(inclusive).customers: take a look at the columndob. Based on its values, what do you believe it was supposed to contain? Can we rely on the numbers selected? Why or why not? Based on your answer, keep the columnsakeed_customer_id,gender, anddob, OR justakeed_customer_idandgender.vendors: take a look at columnscountry_idandcity_id. Would they be useful to compare the vendors in our dataset? Why or why not? If not, remove the columns from the dataset.
Relevant topics:
Item(s) to submit:
- R code used to solve the problem.
- Output from running your code.
-
1-2 sentences describing what columns you kept for
vendorsandcustomersand why.
3. Use your solutions from questions (1) and (2), and the join functions from tidyverse (inner_join, left_join, right_join, and full_join) to create a single tibble called myDF containing information only where all 3 tibbles intersect.
For example, we do not want myDF to contain orders from customers that are not in customers tibble. Which function(s) from the tidyverse did you use to merge the datasets and why?
Hint: myDF should have 132,226 rows.
Hint: When combining two datasets, you may want to change the argument suffix in the join function to specify from which dataset it came from. For example, when joining customers and orders: *_join(customers, orders, suffix = c('_customers', '_orders')).
Relevant topics: inner_join, left_join, right_join, full_join
Item(s) to submit:
- R code used to solve the problem.
- Output from running your code.
- 1-2 sentences describing which function you used, and why.
4. Great, now we have a single, tidy dataset to work with. There are 2 vendor categories in myDF, Restaurants and Sweets & Bakes. We would expect there to be some differences. Let's compare them using the following variables: deliverydistance, item_count, grand_total, and vendor_discount_amount. Our end goal (by the end of question 5) is to create a histogram colored by the vendor's category (vendor_category_en), for each variable.
To accomplish this easily using ggplot, we will take advantage of pivot_longer. Pivot columns deliverydistance, item_count, grand_total, and vendor_discount_amount in myDF. The end result should be a tibble with columns variable and values, which contain the name of the pivoted column (variable), and values of those columns (values) Call this modified dataset myDF_long.
Relevant topics: pivot_longer
Item(s) to submit:
- R code used to solve the problem.
- Output from running your code.
5. Now that we have the data in the ideal format for our plot, create a histogram for each variable. Make sure to color them by vendor category (vendor_category_en). How do the two types of vendors compare in these 4 variables?
Hint: Use the argument fill instead of color in geom_histogram.
Hint: You may want to add some transparency to your plot. Add it using alpha argument in geom_histogram.
Hint: You may want to change the argument scales in facet_*.
Relevant topics: geom_histogram, facet_wrap, facet_grid
Item(s) to submit:
- R code used to solve the problem.
- Output from running your code.
-
2-3 sentences comparing
RestaurantsandSweets & Bakesfordeliverydistance,item_count,grand_totalandvendor_discount_amount.
Project 13
Motivation: Data wrangling tasks can vary between projects. Examples include joining multiple data sources, removing data that is irrelevant to the project, handling outliers, etc. Although we've practiced some of these skills, it is always worth it to spend some extra time to master tidying up our data.
Context: We will continue to gain familiarity with the tidyverse suite of packages (including ggplot), and data wrangling tasks.
Scope: r, tidyverse
Learning objectives:
- Explain the differences between regular data frames and tibbles.
- Use mutate, pivot, unite, filter, and arrange to wrangle data and solve data-driven problems.
- Combine different data using joins (left_join, right_join, semi_join, anti_join), and bind_rows.
- Group data and calculate aggregated statistics using group_by, mutate, and transmute functions.
- Demonstrate the ability to create basic graphs with default settings, in ggplot.
- Demonstrate the ability to modify axes labels and titles.
Make sure to read about, and use the template found here, and the important information about projects submissions here.
Dataset
The following questions will use the dataset found in Scholar:
/class/datamine/data/consumer_complaints/Consumer_Complaints.csv
Questions
1. Read the dataset into a tibble named complaintsDF. This dataset contains consumer complaints for over 5,000 companies. Our goal is to create a tibble called companyDF containing the following summary information for each company:
Company: The company name (Company)State: The state (State)percent_timely_response: Percentage of timely complaints (Timely response?)percent_consumer_disputed: Percentage of complaints that were disputed by the consumer (Consumer disputed?)percent_submitted_online: Percentage of complaints that were submitted online (use columnSubmitted via, and consider a submission to be an online submission if it was submitted viaWeborEmail)total_n_complaints: Total number of complaints
There are various ways to create companyDF. Let's practice using the pipes (%>%) to get companyDF. The idea is that our code at the end of question 2 will look something like this:
companyDF <- complaintsDF %>%
insert_here_code_to_change_variables %>% # (question 1)
insert_here_code_to_group_and_get_summaries_per_group # (question 2)First, create logical columns (columns containing TRUE or FALSE) for Timely response?, Consumer disputed? and Submitted via named timely_response_log, consumer_disputed_log and submitted_online, respectively.
timely_response_log and consumer_disputed_log will have value TRUE if Timely response? and Consumer disputed? have values Yes respectively, and FALSE if the value for the original column is No. submitted_online will have value TRUE if the the complaint was submitted via Web or Email.
You can double check your results for each column by getting a table with the original and modified column, as shown below. In this case, we would want all TRUE values to be in row Yes, and all FALSE to be in row No.
table(companyDF$`Timely response?`, companyDF$timely_response_log)Relevant topics: %>%, mutate, case_when
Item(s) to submit:
- R code used to solve the problem.
- Output from running your code.
2. Continue the pipeline we started in question (1). Get the summary information for each company. Note that you will need to include more pipes in the pseudo-code from question (1) as we want the summary for each company in each state. If a company is present in 4 states, companyDF should have 4 rows for that company -- one for each state. For the rest of the project, we will refer to a company as its unique combination of Company and State.
Hint: The function n() from dplyr counts the number of observations in the current group. It can only by used within mutate/transmute, filter, and the summarize functions.
Relevant topics: group_by, summarize, mean, n
Item(s) to submit:
- R code used to solve the problem.
- Output from running your code.
3. Using ggplot2, create a scatterplot showing the relationship between percent_timely_response and percent_consumer_disputed for companies with at least 500 complaints. Based on your results, do you believe there is an association between how timely the company's response is, and whether the consumer disputes? Why or why not?
Hint: Remember, here we consider each row of companyDF a unique company.
Relevant topics: filter, geom_point
Item(s) to submit:
- R code used to solve the problem.
- Output from running your code.
4. Which company, with at least 250 complaints, has the highest percent of consumer dispute?
Important note: We are learning tidyverse, so use tidyverse functions to solve this problem.
Relevant topics: filter, arrange
Item(s) to submit:
- R code used to solve the problem.
- Output from running your code.
5. (OPTIONAL, 0 pts) Create a graph using ggplot2 that compares States based on any columns from companyDF or complaintsDF. You may need to summarize the data, filter, or even create new variables depending on what your metric of comparison is. Below are some examples of graphs that can be created. Do not feel limited by them. Make sure to change the labels for each axis, add a title, and change the theme.
- Cleveland's dotplot for the top 10 states with the highest ratio between percent of disputed complaints and timely response.
- Bar graph showing the total number of complaints in each state.
- Scatterplot comparing the percentage of timely responses in the state and average number of complaints per state.
- Line plot, where each line is a state, showing the total number of complaints per year.
Relevant topics:
Item(s) to submit:
- R code used to solve the problem.
- Output from running your code.
- The plot produced.
- 1-2 sentences commenting on your plot.
Project 14
Motivation: We covered a lot this year! When dealing with data driven projects, it is useful to explore the data, and answer different questions to get a feel for it. There are always different ways one can go about this. Proper preparation prevents poor performance, in this project we are going to practice using some of the skills you've learned, and review topics and languages in a generic way.
Context: We are on the last project where we will leave it up to you on how to solve the problems presented.
Scope: python, r, bash, unix, computers
Make sure to read about, and use the template found here, and the important information about projects submissions here.
Dataset
The following questions will use the dataset found in Scholar:
/class/datamine/data/disney/class/datamine/data/movies_and_tv/imdb.db/class/datamine/data/amazon/music.txt/class/datamine/data/craigslist/vehicles.csv/class/datamine/data/flights/2008.csv
Questions
Important: Answer the questions below using the language of your choice (R, Python, bash, awk, etc.). Don't feel limited by one language, you can use different languages to answer different questions. If you are feeling bold, you can also try answering the questions using all languages!
1. What percentage of flights in 2008 had a delay due to the weather? Use the /class/datamine/data/flights/2008.csv dataset to answer this question.
Hint: Consider a flight to have a weather delay if WEATHER_DELAY is greater than 0.
Item(s) to submit:
- The code used to solve the question.
- The answer to the question.
2. Which listed manufacturer has the most expensive previously owned car listed in Craiglist? Use the /class/datamine/data/craigslist/vehicles.csv dataset to answer this question. Only consider listings that have listed price less than $500,000 and where manufacturer information is available.
Item(s) to submit:
- The code used to solve the question.
- The answer to the question.
3. What is the most common and least common type of title in imdb ratings? Use the /class/datamine/data/movies_and_tv/imdb.db dataset to answer this question.
Hint: Use the titles table.
Hint: Don't know how to use SQL yet? To get this data into an R data.frame , for example:
library(tidyverse)
con <- DBI::dbConnect(RSQLite::SQLite(), ":memory:")
myDF <- tbl(con, "titles")Item(s) to submit:
- The code used to solve the question.
- The answer to the question.
4. What percentage of music reviews contain the words hate or hated, and what percentage contain the words love or loved? Use the /class/datamine/data/amazon/music.txt dataset to answer this question.
Hint: It may take a minute to run, depending on the tool you use.
Item(s) to submit:
- The code used to solve the question.
- The answer to the question.
5. What is the best time to visit Disney? Use the data provided in /class/datamine/data/disney to answer the question.
First, you will need determine what you will consider "time", and the criteria you will use. See below some examples. Don't feel limited by them! Be sure to explain your criteria, use the data to investigate, and determine the best time to visit! Write 1-2 sentences commenting on your findings.
- As Splash Mountain is my favorite ride, my criteria is the smallest monthly average wait times for Splash Mountain between the years 2017 and 2019. I'm only considering these years as I expect them to be more representative. My definition of "best time" will be the "best months".
- Consider "best times" the days of the week that have the smallest wait time on average for all rides, or for certain favorite rides.
- Consider "best times" the season of the year where the park is open for longer hours.
- Consider "best times" the weeks of the year with smallest average high temperature in the day.
Item(s) to submit:
- The code used to solve the question.
- 1-2 sentences detailing the criteria you are going to use, its logic, and your defition for "best time".
- The answer to the question.
- 1-2 sentences commenting on your answer.
6. Finally, use RMarkdown (and its formatting) to outline 3 things you learned this semester from The Data Mine. For each thing you learned, give a mini demonstration where you highlight with text and code the thing you learned, and why you think it is useful. If you did not learn anything this semester from The Data Mine, write about 3 things you want to learn. Provide examples that demonstrate what you want to learn and write about why it would be useful.
Important: Make sure your answer to this question is formatted well and makes use of RMarkdown.
Item(s) to submit:
- 3 clearly labeled things you learned.
- 3 mini-demonstrations where you highlight with text and code the thin you learned, and why you think it is useful.
OR
- 3 clearly labeled things you want to learn.
- 3 examples demonstrating what you want to learn, with accompanying text explaining why you think it would be useful.
STAT 39000
Topics
The following table roughly highlights the topics and projects for the semester. This is slightly adjusted throughout the semester as student performance and feedback is taken into consideration.
| Language | Project # | Name | Topics |
|---|---|---|---|
| Python | 1 | Web scraping: part I | xml, lxml, pandas, etc. |
| Python | 2 | Web scraping: part II | requests, functions, xml, loops, if statements, etc. |
| Python | 3 | Web scraping: part III | selenium, lxml, lists, pandas, etc. |
| Python | 4 | Web scraping: part IV | requests, beautifulsoup4, lxml, selenium, xml, cronjobs, loops, etc. |
| Python | 5 | Web scraping: part V | web scraping + related topics |
| Python | 6 | Plotting in Python: part I | ways to plot in Python, more work with pandas, etc. |
| Python | 7 | Plotting in Python: part II | ways to plot in Python, more work with pandas, etc. |
| Python | 8 | Writing scripts: part I | how to write scripts in Python, more work with pandas, matplotlib, etc. |
| Python | 9 | Writing scripts: part II | how to write scripts in Python, argparse, more work with pandas, matplotlib, etc. |
| R | 10 | ggplot: part I | ggplot basics |
| R | 11 | ggplot: part II | more ggplot |
| R | 12 | tidyverse & data.table: part I | data wrangling and computation using tidyverse packages and data.table, maybe some slurm? |
| R | 13 | tidyverse & data.table: part II | data wrangling and computation using tidyverse packages and data.table, maybe some slurm? |
| R | 14 | tidyverse & data.table: part III | data wrangling and computation using tidyverse packages and data.table, maybe some slurm? |
Project 1
Motivation: Extensible Markup Language or XML is a very important file format for storing structured data. Even though formats like JSON, and csv tend to be more prevalent, many, many legacy systems still use XML, and it remains an appropriate format for storing complex data. In fact, JSON and csv are quickly becoming less relevant as new formats and serialization methods like parquet and protobufs are becoming more common.
Context: In previous semesters we've explored XML. In this project we will refresh our skills and, rather than exploring XML in R, we will use the lxml package in Python. This is the first project in a series of 5 projects focused on web scraping in R and Python.
Scope: python, XML
Learning objectives:
- Review and summarize the differences between XML and HTML/CSV.
- Match XML terms to sections of XML demonstrating working knowledge.
Make sure to read about, and use the template found here, and the important information about projects submissions here.
Dataset
The following questions will use the dataset found in Scholar:
/class/datamine/data/apple/health/watch_dump.xml
Resources
We realize that it may be a while since you've used Python. That's okay! We are going to be taking things at a much more reasonable pace than Spring 2020.
Some potentially useful resources for the semester include:
- The STAT 19000 projects. We are easing 19000 students into Python and will post solutions each week. It would be well worth 10 minutes to look over the questions and solutions each week.
- Here is a decent cheat sheet that helps you quickly get an idea of how to do something you know how to do in R, in Python.
- The Examples Book -- updating daily with more examples and videos. Be sure to click on the "relevant topics" links as we try to point you to topics with examples that should be particularly useful to solve the problems we assign.
Questions
Important note: It would be well worth your time to read through the xml section of the book, as well as take the time to work through pandas 10 minute intro.
1. A good first step when working with XML is to get an idea how your document is structured. Normally, there should be good documentation that spells this out for you, but it is good to know what to do when you don't have the documentation. Start by finding the "root" node. What is the name of the root node of the provided dataset?
Hint: Make sure to import the lxml package first:
from lxml import etreeHere are two videos about running Python in RStudio:
and here is a video about XML scraping in Python:
Item(s) to submit:
- Python code used to solve the problem.
- Output from running your code.
Solution
from lxml import etree
tree = etree.parse("/class/datamine/data/apple/health/watch_dump.xml")
tree.xpath("/*")[0].tag2. Remember, XML can be nested. In question (1) we figured out what the root node was called. What are the names of the next "tier" of elements?
Hint: Now that we know the root node, you could use the root node name as a part of your xpath expression.
Hint: As you may have noticed in question (1) the xpath method returns a list. Sometimes this list can contain many repeated tag names. Since our goal is to see the names of the second "tier" elements, you could convert the resulting list to a set to quickly see the unique list as set's only contain unique values.
Relevant topics: for loops, lxml, xml
Item(s) to submit:
- Python code used to solve the problem.
- Output from running your code.
Solution
set([x.tag for x in tree.xpath("/HealthData/*")])Solution
print(set([x.tag for x in tree.xpath("/HealthData/*")]))
print(set([x.tag for x in tree.xpath("/HealthData/ActivitySummary/*")]))
print(set([x.tag for x in tree.xpath("/HealthData/Record/*")]))
print(set([x.tag for x in tree.xpath("/HealthData/Workout/*")]))
print(set([x.tag for x in tree.xpath("/HealthData/Record/HeartRateVariabilityMetadataList/*")]))
print(set([x.tag for x in tree.xpath("/HealthData/Record/MetadataEntry/*")]))
print(set([x.tag for x in tree.xpath("/HealthData/Workout/WorkoutEvent/*")]))
print(set([x.tag for x in tree.xpath("/HealthData/Workout/WorkoutRoute/*")]))
print(set([x.tag for x in tree.xpath("/HealthData/Workout/WorkoutEntry/*")]))
print(set([x.tag for x in tree.xpath("/HealthData/Record/HeartRateVariabilityMetadataList/InstantaneousBeatsPerMinute/*")]))
print(set([x.tag for x in tree.xpath("/HealthData/Workout/WorkoutRoute/FileReference/*")]))
print(set([x.tag for x in tree.xpath("/HealthData/Workout/WorkoutRoute/MetadataEntry/*")]))/HealthData/Record/HeartRateVariabilityMetadataList/InstantaneousBeatsPerMinute /HealthData/Workout/WorkoutRoute/FileReference /HealthData/Workout/WorkoutRoute/MetadataEntry /HealthData/Record/MetadataEntry /HealthData/Workout/WorkoutEvent /HealthData/Workout/WorkoutEntry /HealthData/ActivitySummary
Or, it could be in an attribute:
<question answer="tac">What is cat spelled backwards?</question>Collect the "ActivitySummary" data, and convert the list of dicts to a pandas DataFrame. The following is an example of converting a list of dicts to a pandas DataFrame called myDF:
import pandas as pd
list_of_dicts = []
list_of_dicts.append({'columnA': 1, 'columnB': 2})
list_of_dicts.append({'columnB': 4, 'columnA': 1})
myDF = pd.DataFrame(list_of_dicts)Hint: It is important to note that an element's "attrib" attribute looks and feels like a dict, but it is actually a lxml.etree._Attrib. If you try to convert a list of lxml.etree._Attrib to a pandas DataFrame, it will not work out as you planned. Make sure to first convert each lxml.etree._Attrib to a dict before converting to a DataFrame. You can do so like:
# this will convert a single `lxml.etree._Attrib` to a dict
my_dict = dict(my_lxml_etree_attrib)Relevant topics: dicts, lists, lxml, xml, for loops
Item(s) to submit:
- Python code used to solve the problem.
- Output from running your code.
Solution
dat = tree.xpath("/HealthData/ActivitySummary")
list_of_dicts = []
for e in dat:
list_of_dicts.append(dict(e.attrib))
myDF = pd.DataFrame(data=list_of_dicts)
myDF.sort_values(['activeEnergyBurned'], ascending=False).head()5. pandas is a Python package that provides the DataFrame and Series classes. A DataFrame is very similar to a data.frame in R and can be used to manipulate the data within very easily. A Series is the class that handles a single column of a DataFrame. Go through the pandas in 10 minutes page from the official documentation. Sort, find, and print the top 5 rows of data based on the "activeEnergyBurned" column.
Relevant topics: pandas, dicts, lists, lxml, xml, for loops
Item(s) to submit:
- Python code used to solve the problem.
- Output from running your code.
Solution
# could be anythingProject 2
Motivation: Web scraping is is the process of taking content off of the internet. Typically this goes hand-in-hand with parsing or processing the data. Depending on the task at hand, web scraping can be incredibly simple. With that being said, it can quickly become difficult. Typically, students find web scraping fun and empowering.
Context: In the previous project we gently introduced XML and xpath expressions. In this project, we will learn about web scraping, scrape data from The New York Times, and parse through our newly scraped data using xpath expressions.
Scope: python, web scraping, xml
Learning objectives: html
- Review and summarize the differences between XML and HTML/CSV.
- Use the requests package to scrape a web page.
- Use the lxml package to filter and parse data from a scraped web page.
Make sure to read about, and use the template found here, and the important information about projects submissions here.
Dataset
You will be extracting your own data from online in this project. There is no base dataset.
Questions
By the end of this project you will be able to scrape some data from this website! The first step is to explore the structure of the website. You can either right click and click on "view page source", which will pull up a page full of HTML used to render the page. Alternatively, if you want to focus on a single element, an article title, for example, right click on the article title and click on "inspect element". This will pull up an inspector that allows you to see portions of the HTML.
Copy and paste the h1 element (in its entirety) containing the article title (for the article provided) in an HTML code chunk. Do the same for the same article's summary.
Relevant topics: html
Item(s) to submit:
- 2 code chunks containing the HTML requested.
Solution
<h1 id="link-4686dc8b" class="css-rsa88z e1h9rw200" data-test-id="headline">U.S. Says China’s Repression of Uighurs Is ‘Genocide’</h1><p id="article-summary" class="css-w6ymp8 e1wiw3jv0">The finding by the Trump administration is the strongest denunciation by any government of China’s actions and follows a Biden campaign statement with the same declaration.</p>2. In question (1) we copied two elements of an article. When scraping data from a website, it is important to continually consider the patterns in the structure. Specifically, it is important to consider whether or not the defining characteristics you use to parse the scraped data will continue to be in the same format for new data. What do I mean by defining characterstic? I mean some combination of tag, attribute, and content from which you can isolate the data of interest.
For example, given a link to a new nytimes article, do you think you could isolate the article title by using the id="link-4686dc8b" attribute of the h1 tag? Maybe, or maybe not, but it sure seems like "link-4686dc8b" might be unique to the article and not able to be used given a new article.
Write an xpath expression to isolate the article title, and another xpath expression to isolate the article summary.
Important note: You do not need to test your xpath expression yet, we will be doing that shortly.
Relevant topics: html, xml, xpath expressions
Item(s) to submit:
- Two xpath expressions in an HTML code chunk.
Solution
//h1[@data-test-id="headline"]//p[@id="article-summary"]3. Use the requests package to scrape the webpage containing our article from questions (1) and (2). Use the lxml.html package and the xpath method to test out your xpath expressions from question (2). Did they work? Print the content of the elements to confirm.
Relevant topics: html, xml, xpath expressions, lxml
Item(s) to submit:
- Python code used to solve the problem.
- Output from running your code.
Solution
import lxml.html
import requests
url = "https://www.nytimes.com/2021/01/19/us/politics/trump-china-xinjiang.html"
response = requests.get(url, stream=True)
response.raw.decode_content = True
tree = lxml.html.parse(response.raw)
print(tree.xpath('//p[@id="article-summary"]')[0].text)
print(tree.xpath('//h1[@data-test-id="headline"]')[0].text)4. Here are a list of article links from https://nytimes.com:
https://www.nytimes.com/2021/01/19/us/politics/trump-china-xinjiang.html
https://www.nytimes.com/2021/01/13/movies/letterboxd-growth.html
Write a function called get_article_and_summary that accepts a string called link as an argument, and returns both the article title and summary. Test get_article_and_summary out on each of the provided links:
title, summary = get_article_and_summary('https://www.nytimes.com/2021/01/19/us/politics/trump-china-xinjiang.html')
print(f'Title: {title}, Summary: {summary}')
title, summary = get_article_and_summary('https://www.nytimes.com/2021/01/06/technology/personaltech/tech-2021-augmented-reality-chatbots-wifi.html')
print(f'Title: {title}, Summary: {summary}')
title, summary = get_article_and_summary('https://www.nytimes.com/2021/01/13/movies/letterboxd-growth.html')
print(f'Title: {title}, Summary: {summary}')Hint: The first line of your function should look like this:
def get_article_and_summary(myURL: str) -> (str, str):
Relevant topics: html, xml, xpath expressions, lxml, functions
Item(s) to submit:
- Python code used to solve the problem.
- Output from running your code.
Solution
from typing import Tuple
import lxml.html
import requests
def get_article_and_summary(link: str) -> Tuple[str, str]:
"""
Given a link to a new york times article, return the article title and summary.
Args:
link (str): The link to the new york times article.
Returns:
Tuple[str, str]: A tuple first containing the article title, and then the article summary.
"""
# scrape the web page
response = requests.get(link, stream=True)
response.raw.decode_content = True
tree = lxml.html.parse(response.raw)
title = tree.xpath('//p[@id="article-summary"]')[0].text
summary = tree.xpath('//h1[@data-test-id="headline"]')[0].text
return title, summarytitle, summary = get_article_and_summary('https://www.nytimes.com/2021/01/19/us/politics/trump-china-xinjiang.html')
print(f'Title: {title}, Summary: {summary}')
title, summary = get_article_and_summary('https://www.nytimes.com/2021/01/06/technology/personaltech/tech-2021-augmented-reality-chatbots-wifi.html')
print(f'Title: {title}, Summary: {summary}')
title, summary = get_article_and_summary('https://www.nytimes.com/2021/01/13/movies/letterboxd-growth.html')
print(f'Title: {title}, Summary: {summary}')5. In question (1) we mentioned a myriad of other important information given at the top of most New York Times articles. Choose two other listed pieces of information and copy, paste, and update your solution to question (4) to scrape and return those chosen pieces of information.
Important note: If you choose to scrape non-textual data, be sure to return data of an appropriate type. For example, if you choose to scrape one of the images, either print the image or return a PIL object.
Relevant topics: html, xml, xpath expressions, lxml, functions
Item(s) to submit:
- Python code used to solve the problem.
- Output from running your code.
Solution
from typing import Tuple
import lxml.html
import requests
import io
from PIL import Image
from IPython.display import display

def get_article_and_summary(link: str) -> Tuple[str, str]:
    """
    Given a link to a new york times article, return the article title and summary.

    Args:
        link (str): The link to the new york times article.

    Returns:
        Tuple[str, str]: A tuple first containing the article title, and then the article summary.
    """

    # scrape the web page
    response = requests.get(link, stream=True)
    response.raw.decode_content = True
    tree = lxml.html.parse(response.raw)

    # parse out the title
    title = tree.xpath('//p[@id="article-summary"]')[0].text

    # parse out the summary
    summary = tree.xpath('//h1[@data-test-id="headline"]')[0].text

    # parse out the url to the image
    photo_src = tree.xpath('//picture/img')[0].attrib.get("src")

    # scrape image
    photo_content = requests.get(photo_src).content

    # convert image format
    photo_file = io.BytesIO(photo_content)
    photo = Image.open(photo_file).convert('RGB')

    # parse out photo caption
    caption = tree.xpath('//figcaption/span')[0].text

    # parse out the photo credits
    credits = tree.xpath('//figcaption/span/span[contains(text(), "Credit")]/following-sibling::span/span')

    credits_list = []
    for c in credits:
        credits_list.append(c.text)

    # parse author photo url
    # only gets if "author" in photo src attribute
    photo_src_elements = tree.xpath('//img[contains(@src, "author")]')

    # if "author" in photo src attribute
    photo_srcs = []
    for p in photo_src_elements:
        photo_srcs.append(p.attrib.get("src"))

    # scrape image
    author_images = []
    for img in photo_srcs:
        photo_content = requests.get(img).content

        # convert image format
        photo_file = io.BytesIO(photo_content)
        photo = Image.open(photo_file).convert('RGB')

        author_images.append(photo)

    # parse out authors
    authors_elements = tree.xpath("//span[@class='byline-prefix']/following-sibling::a/span")
    authors = []
    for a in authors_elements:
        authors.append(a.text)

    # parse out article publish date/time
    dt = tree.xpath("//time")[0].attrib.get("datetime")

    return title, summary, photo, caption, credits, author_images, authors, dt


title, summary, photo, caption, credits, author_images, authors, dt = get_article_and_summary('https://www.nytimes.com/2021/01/19/us/politics/trump-china-xinjiang.html')
print(f'Title:\n{title}, Summary:\n{summary}, Caption:\n{caption}')
title, summary, photo, caption, credits, author_images, authors, dt = get_article_and_summary('https://www.nytimes.com/2021/01/06/technology/personaltech/tech-2021-augmented-reality-chatbots-wifi.html')
print(f'Title:\n{title}, Summary:\n{summary}, Caption:\n{caption}')
title, summary, photo, caption, credits, author_images, authors, dt = get_article_and_summary('https://www.nytimes.com/2021/01/13/movies/letterboxd-growth.html')
print(f'Title:\n{title}, Summary:\n{summary}, Caption:\n{caption}')
Project 3
Motivation: Web scraping takes practice, and it is important to work through a variety of common tasks in order to know how to handle those tasks when you next run into them. In this project, we will use a variety of scraping tools in order to scrape data from https://trulia.com.
Context: In the previous project, we got our first taste at actually scraping data from a website, and using a parser to extract the information we were interested in. In this project, we will introduce some tasks that will require you to use a tool that let's you interact with a browser, selenium.
Scope: python, web scraping, selenium
Learning objectives:
- Review and summarize the differences between XML and HTML/CSV.
- Use the requests package to scrape a web page.
- Use the lxml package to filter and parse data from a scraped web page.
- Use selenium to interact with a browser in order to get a web page to a desired state for scraping.
Make sure to read about, and use the template found here, and the important information about projects submissions here.
Questions
1. Visit https://trulia.com. Many websites have a similar interface, i.e. a bold and centered search bar for a user to interact with. Using selenium write Python code that that first finds the input element, and then types "West Lafayette, IN" followed by an emulated "Enter/Return". Confirm you code works by printing the url after that process completes.
Hint: You will want to use time.sleep to pause a bit after the search so the updated url is returned.
That video is already relevant for Question 2 too.
Relevant topics: selenium, xml
Item(s) to submit:
- Python code used to solve the problem.
- Output from running your code.
Solution
from selenium import webdriver
from selenium.webdriver.common.keys import Keys
from selenium.webdriver.firefox.options import Options
from selenium.common.exceptions import NoSuchElementException

import time
firefox_options = Options()
firefox_options.add_argument("window-size=1920,1080")
firefox_options.add_argument("--headless") # Headless mode means no GUI
firefox_options.add_argument("start-maximized")
firefox_options.add_argument("disable-infobars")
firefox_options.add_argument("--disable-extensions")
firefox_options.add_argument("--no-sandbox")
firefox_options.add_argument("--disable-dev-shm-usage")
firefox_options.binary_location = '/class/datamine/apps/firefox/firefox'driver = webdriver.Firefox(options=firefox_options, executable_path='/class/datamine/apps/geckodriver')
url = 'https://www.trulia.com'
driver.get(url)
search_input = driver.find_element_by_id("banner-search")
search_input.send_keys("West Lafayette, IN")
search_input.send_keys(Keys.RETURN)
time.sleep(3)
print(driver.current_url)2. Use your code from question (1) to test out the following queries:
- West Lafayette, IN (City, State)
- 47906 (Zip)
- 4505 Kahala Ave, Honolulu, HI 96816 (Full address)
If you look closely you will see that there are patterns in the url. For example, the following link would probably bring up homes in Crawfordsville, IN: https://trulia.com/IN/Crawfordsville. With that being said, if you only had a zip code, like 47933, it wouldn't be easy to guess https://www.trulia.com/IN/Crawfordsville/47933/, hence, one reason why the search bar is useful.
If you used xpath expressions to complete question (1), instead use a different method to find the input element. If you used a different method, use xpath expressions to complete question (1).
Relevant topics: selenium, xml
Item(s) to submit:
- Python code used to solve the problem.
- Output from running your code.
Solution
driver = webdriver.Firefox(options=firefox_options, executable_path='/class/datamine/apps/geckodriver')
url = 'https://www.trulia.com'
driver.get(url)

search_input = driver.find_element_by_xpath("//input[@id='banner-search']")
search_input.send_keys("West Lafayette, IN")
search_input.send_keys(Keys.RETURN)
time.sleep(3)
print(driver.current_url)
3. Let's call the page after a city/state or zipcode search a "sales page". For example:
Use requests to scrape the entire page: https://www.trulia.com/IN/West_Lafayette/47906/. Use lxml.html to parse the page and get all of the img elements that make up the house pictures on the left side of the website.
Important note: Make sure you are actually scraping what you think you are scraping! Try printing your html to confirm it has the content you think it should have:
import requests
response = requests.get(...)
print(response.text)
Hint: Are you human? Depends. Sometimes if you add a header to your request, it won't ask you if you are human. Let's pretend we are Firefox:
import requests
my_headers = {'User-Agent': 'Mozilla/5.0'}
response = requests.get(..., headers=my_headers)
Okay, after all of that work you may have discovered that only a few images have actually been scraped. If you cycle through all of the img elements and try to print the value of the src attribute, this will be clear:
import lxml.html
tree = lxml.html.fromstring(response.text)
elements = tree.xpath("//img")
for element in elements:
    print(element.attrib.get("src"))
This is because the webpage is not immediately, completely loaded. This is a common website behavior to make things appear faster. If you pay close to when you load https://www.trulia.com/IN/Crawfordsville/47933/, and you quickly scroll down, you will see images still needing to finish rendering all of the way, slowly. What we need to do to fix this, is use selenium (instead of lxml.html) to behave like a human and scroll prior to scraping the page! Try using the following code to slowly scroll down the page before finding the elements:
# driver setup and get the url

# Needed to get the window size set right and scroll in headless mode
myheight = driver.execute_script('return document.body.scrollHeight')
driver.set_window_size(1080,myheight+100)

def scroll(driver, scroll_point):
    driver.execute_script(f'window.scrollTo(0, {scroll_point});')
    time.sleep(5)

scroll(driver, myheight*1/4)
scroll(driver, myheight*2/4)
scroll(driver, myheight*3/4)
scroll(driver, myheight*4/4)

# find_elements_by_*
Hint: At the time of writing there should be about 86 links to images of homes.
Relevant topics: selenium, xml, loops
Item(s) to submit:
- Python code used to solve the problem.
- Output from running your code.
Solution
driver = webdriver.Firefox(options=firefox_options, executable_path='/Users/kamstut/Downloads/geckodriver')
url = 'https://www.trulia.com/IN/West_Lafayette/47906/'
driver.get(url)

# Needed to get the window size set right and scroll in headless mode
height = driver.execute_script('return document.body.scrollHeight')
driver.set_window_size(1080,height+100)

def scroll(driver, scroll_point):
    driver.execute_script(f'window.scrollTo(0, {scroll_point});')
    time.sleep(5)

scroll(driver, height/4)
scroll(driver, height/4*2)
scroll(driver, height/4*3)
scroll(driver, height)

elements = driver.find_elements_by_xpath("//picture/img")
print(len(elements))
for e in elements:
    print(e.get_attribute("src"))
4. Write a function called avg_house_cost that accepts a zip code as an argument, and returns the average cost of the first page of homes. Now, to make this a more meaningful statistic, filter for "3+" beds and then find the average. Test avg_house_cost out on the zip code 47906 and print the average costs.
Important note: Use selenium to "click" on the "3+ beds" filter.
Hint: If you get an error that tells you button is not clickable because it is covered by an li element, try clicking on the li element instead.
Hint: You will want to wait a solid 10-15 seconds for the sales page to load before trying to select or click on anything.
Hint: Your results may end up including prices for "Homes Near <ZIPCODE>". This is okay. Even better if you manage to remove those results. If you do choose to remove those results, take a look at the data-testid attribute with value search-result-list-container. Perhaps only selecting the children of the first element will get the desired outcome.
Hint: You can use the following code to remove the non-numeric text from a string, and then convert to an integer:
import re

int(re.sub("[^0-9]", "", "removenon45454_numbers$"))Relevant topics: selenium, xml, loops, functions
Item(s) to submit:
- Python code used to solve the problem.
- Output from running your code.
Solution
from selenium.webdriver.support.ui import WebDriverWait
import re

def avg_house_cost(zip: str) -> float:
    firefox_options = Options()
    firefox_options.add_argument("window-size=1920,1080")
    # firefox_options.add_argument("--headless") # Headless mode means no GUI
    firefox_options.add_argument("start-maximized")
    firefox_options.add_argument("disable-infobars")
    firefox_options.add_argument("--disable-extensions")
    firefox_options.add_argument("--no-sandbox")
    firefox_options.add_argument("--disable-dev-shm-usage")
    firefox_options.binary_location = '/Applications/Firefox.app/Contents/MacOS/firefox'

    driver = webdriver.Firefox(options=firefox_options, executable_path='/Users/kamstut/Downloads/geckodriver')
    url = 'https://www.trulia.com/'
    driver.get(url)

    search_input = driver.find_element_by_id("banner-search")
    search_input.send_keys(zip)
    search_input.send_keys(Keys.RETURN)
    time.sleep(10)

    allbed_button = driver.find_element_by_xpath("//button[@data-testid='srp-xl-bedrooms-filter-button']/ancestor::li")
    allbed_button.click()
    time.sleep(2)

    bed_button = driver.find_element_by_xpath("//button[contains(text(), '3+')]")
    bed_button.click()
    time.sleep(3)

    price_elements = driver.find_elements_by_xpath("(//div[@data-testid='search-result-list-container'])[1]//div[@data-testid='property-price']")
    prices = [int(re.sub("[^0-9]", "", e.text)) for e in price_elements]

    driver.quit()

    return sum(prices)/len(prices)

avg_house_cost('47906')
5. Get creative. Either add an interesting feature to your function from (4), or use matplotlib to generate some sort of accompanying graphic with your output. Make sure to explain what your additions do.
Relevant topics: selenium, xml, loops
Item(s) to submit:
- Python code used to solve the problem.
- Output from running your code.
Solution
Could be anything.
Project 4
Motivation: In this project we will continue to hone your web scraping skills, introduce you to some "gotchas", and give you a little bit of exposure to a powerful tool called cron.
Context: We are in the second to last project focused on web scraping. This project will introduce some supplementary tools that work well with web scraping: cron, sending emails from Python, etc.
Scope: python, web scraping, selenium, cron
Learning objectives:
- Review and summarize the differences between XML and HTML/CSV.
- Use the requests package to scrape a web page.
- Use the lxml package to filter and parse data from a scraped web page.
- Use the beautifulsoup4 package to filter and parse data from a scraped web page.
- Use selenium to interact with a browser in order to get a web page to a desired state for scraping.
Make sure to read about, and use the template found here, and the important information about projects submissions here.
Questions
1. Check out the following website: https://project4.tdm.wiki
Use selenium to scrape and print the 6 colors of pants offered.
Click here for video for Question 1
Hint: You may have to interact with the webpage for certain elements to render.
Relevant topics: scraping, selenium, example clicking a button
Item(s) to submit:
- Python code used to solve the problem.
- Output from running your code.
Solution
from selenium import webdriver
from selenium.webdriver.common.keys import Keys
from selenium.webdriver.firefox.options import Options
from selenium.common.exceptions import NoSuchElementException

import timedriver.get("https://project4.tdm.wiki/")
elements = driver.find_elements_by_xpath("//span[@class='ui-component-card--color-amount']")
for element in elements:
print(element.text)
# click the "wild colors" button
label = driver.find_element_by_xpath("//label[@for='ui-component-toggle__wild']")
label.click()
elements = driver.find_elements_by_xpath("//span[@class='ui-component-card--color-amount']")
for element in elements:
print(element.text)
driver.quit()2. Websites are updated frequently. You can imagine a scenario where a change in a website is a sign that there is more data available, or that something of note has happened. This is a fake website designed to help students emulate real changes to a website. Specifically, there is one part of the website that has two possible states (let's say, state A and state B). Upon refreshing the website, or scraping the website again, there is an \(x\%\) chance that the website will be in state A and a \(1-x\%\) chance the website will be in state B.
Describe the two states (the thing (element or set of elements) that changes as you refresh the page), and scrape the website enough to estimate \(x\).
Click here for video for Questions 2 and 3
Hint: You will need to interact with the website to "see" the change.
Hint: Since we are just asking about a state, and not any specific element, you could use the page_source attribute of the selenium driver to scrape the entire page instead of trying to use xpath expressions to find a specific element.
Hint: Your estimate of \(x\) does not need to be perfect.
Relevant topics: scraping, selenium, example clicking a button
Item(s) to submit:
- Python code used to solve the problem.
- Output from running your code.
-
What state
AandBrepresent. -
An estimate for
x.
Solution
25% in stock 75% out of stock -- anything remotely close give full credit
# The state of the Chartreuse pants, sold out (A) or in stock (B)
driver = webdriver.Firefox(options=firefox_options, executable_path='/class/datamine/apps/geckodriver')
driver.get("https://project4.tdm.wiki/")

# click the "wild colors" button
label = driver.find_element_by_xpath("//label[@for='ui-component-toggle__wild']")
label.click()

stateA = driver.page_source
stateAct = 0
stateBct = 0
for i in range(10):
    driver = webdriver.Firefox(options=firefox_options, executable_path='/class/datamine/apps/geckodriver')
    driver.get("https://project4.tdm.wiki/")

    # click the "wild colors" button
    label = driver.find_element_by_xpath("//label[@for='ui-component-toggle__wild']")
    label.click()

    if driver.page_source == stateA:
        stateAct += 1
    else:
        stateBct += 1

    driver.quit()

print(f"State A: {stateAct}")
print(f"State B: {stateBct}")
3. Dig into the changing "thing" from question (2). What specifically is changing? Use selenium and xpath expressions to scrape and print the content. What are the two possible values for the content?
Click here for video (same as above) for Questions 2 and 3
Hint: Due to the changes that occur when a button is clicked, I'd highly advice you to use the data-color attribute in your xpath expression instead of contains(text(), 'blahblah').
Hint: parent:: and following-sibling:: may be useful xpath axes to use.
Relevant topics: scraping, selenium, example using following-sibling::
Item(s) to submit:
- Python code used to solve the problem.
- Output from running your code.
Solution
# The state of the Chartreuse pants, sold out (A) or in stock (B)
driver = webdriver.Firefox(options=firefox_options, executable_path='/class/datamine/apps/geckodriver')
driver.get("https://project4.tdm.wiki/")

# click the "wild colors" button
label = driver.find_element_by_xpath("//label[@for='ui-component-toggle__wild']")
label.click()

element = driver.find_element_by_xpath("//span[@data-color='Chartreuse']/parent::div/following-sibling::div/span")
print(element.text)

driver.quit()
4. The following code allows you to send an email using Python from your Purdue email account. Replace the username and password with your own information and send a test email to yourself to ensure that it works.
Click here for video for Questions 4 and 5
Important note: Do NOT include your password in your homework submission. Any time you need to type your password in you final submission just put something like "SUPERSECRETPASSWORD" or "MYPASSWORD".
Hint: To include an image (or screenshot) in RMarkdown, try  where my_image.png is inside the same folder as your .Rmd file.
Hint: The spacing and tabs near the message variable are very important. Make sure to copy the code exactly. Otherwise, your subject may not end up in the subject of your email, or the email could end up being blank when sent.
Hint: Questions 4 and 5 were inspired by examples and borrowed from the code found at the Real Python website.
def send_purdue_email(my_purdue_email, my_password, to, my_subject, my_message):
  import smtplib, ssl
  from email.mime.text import MIMEText
  from email.mime.multipart import MIMEMultipart

  message = MIMEMultipart("alternative")
  message["Subject"] = my_subject
  message["From"] = my_purdue_email
  message["To"] = to

  # Create the plain-text and HTML version of your message
  text = f'''\
Subject: {my_subject}
To: {to}
From: {my_purdue_email}

{my_message}'''
  html = f'''\
<html>
  <body>
    {my_message}
  </body>
</html>
'''
  # Turn these into plain/html MIMEText objects
  part1 = MIMEText(text, "plain")
  part2 = MIMEText(html, "html")

  # Add HTML/plain-text parts to MIMEMultipart message
  # The email client will try to render the last part first
  message.attach(part1)
  message.attach(part2)

  context = ssl.create_default_context()
  with smtplib.SMTP("smtp.purdue.edu", 587) as server:
    server.ehlo()  # Can be omitted
    server.starttls(context=context)
    server.ehlo()  # Can be omitted
    server.login(my_purdue_email, my_password)
    server.sendmail(my_purdue_email, to, message.as_string())

# this sends an email from kamstut@purdue.edu to mdw@purdue.edu
# replace supersecretpassword with your own password
# do NOT include your password in your homework submission.
send_purdue_email("kamstut@purdue.edu", "supersecretpassword", "mdw@purdue.edu", "put subject here", "put message body here")
Relevant topics: functions
Item(s) to submit:
- Python code used to solve the problem.
- Output from running your code.
- Screenshot showing your received the email.
Solution
import smtplib, ssl

port = 587  # For starttls
smtp_server = "smtp.purdue.edu"
sender_email = "kamstut@purdue.edu"
receiver_email = "kamstut@purdue.edu"
password = "MYPASSWORD"
message = """\
Subject: Hi there

This message is sent from Python."""

context = ssl.create_default_context()
with smtplib.SMTP(smtp_server, port) as server:
    server.ehlo()  # Can be omitted
    server.starttls(context=context)
    server.ehlo()  # Can be omitted
    server.login(sender_email, password)
    server.sendmail(sender_email, receiver_email, message)
5. The following is the content of a new Python script called is_in_stock.py:
def send_purdue_email(my_purdue_email, my_password, to, my_subject, my_message):
  import smtplib, ssl
  from email.mime.text import MIMEText
  from email.mime.multipart import MIMEMultipart

  message = MIMEMultipart("alternative")
  message["Subject"] = my_subject
  message["From"] = my_purdue_email
  message["To"] = to

  # Create the plain-text and HTML version of your message
  text = f'''\
Subject: {my_subject}
To: {to}
From: {my_purdue_email}

{my_message}'''
  html = f'''\
<html>
  <body>
    {my_message}
  </body>
</html>
'''
  # Turn these into plain/html MIMEText objects
  part1 = MIMEText(text, "plain")
  part2 = MIMEText(html, "html")

  # Add HTML/plain-text parts to MIMEMultipart message
  # The email client will try to render the last part first
  message.attach(part1)
  message.attach(part2)

  context = ssl.create_default_context()
  with smtplib.SMTP("smtp.purdue.edu", 587) as server:
    server.ehlo()  # Can be omitted
    server.starttls(context=context)
    server.ehlo()  # Can be omitted
    server.login(my_purdue_email, my_password)
    server.sendmail(my_purdue_email, to, message.as_string())

def main():
    # scrape element from question 3

    # does the text indicate it is in stock?

    # if yes, send email to yourself telling you it is in stock.

    # otherwise, gracefully end script using the "pass" Python keyword

if __name__ == "__main__":
    main()
First, make a copy of the script in your $HOME directory:
cp /class/datamine/data/scraping/is_in_stock.py $HOME/is_in_stock.pyThe script should now appear in RStudio, in your home directory, with the correct permissions. Open the script (in RStudio) and fill in the main function as indicated by the comments. We want the script to scrape to see whether the pants from question 3 are in stock or not.
A cron job is a task that runs at a certain interval. Create a cron job that runs your script, /class/datamine/apps/python/f2020-s2021/env/bin/python $HOME/is_in_stock.py every 5 minutes. Wait 10-15 minutes and verify that it is working properly. The long path, /class/datamine/apps/python/f2020-s2021/env/bin/python simply makes sure that our script is run with access to all of the packages in our course environment. $HOME/is_in_stock.py is the path to your script ($HOME expands or transforms to /home/<my_purdue_alias>.
Click here for video (same as above) for Questions 4 and 5
Click here for a longer video about setting up the cronjob in Question 5
Hint: If you struggle to use the text editor used with the crontab -e command, be sure to continue reading the cron section of the book. We highlight another method that may be easier.
Hint: Don't forget to copy your import statements from question (3) as well.
Important note: Once you are finished with the project, if you no longer wish to receive emails every so often, follow the instructions here to remove the cron job.
Relevant topics: cron, crontab guru
Item(s) to submit:
- Python code used to solve the problem.
- Output from running your code.
- The content of your cron job in a bash code chunk.
-
The content of your
is_in_stock.pyscript.
Solution
*/5 * * * * /home/kamstut/is_in_stock.py#!/usr/bin/env python3
def send_purdue_email(my_purdue_email, my_password, to):
import smtplib, ssl
port = 587 # For starttls
smtp_server = "smtp.purdue.edu"
sender_email = my_purdue_email
receiver_email = to
password = my_password
message = """\
Subject: Test subject
This is the email body."""
context = ssl.create_default_context()
with smtplib.SMTP(smtp_server, port) as server:
server.ehlo() # Can be omitted
server.starttls(context=context)
server.ehlo() # Can be omitted
server.login(sender_email, password)
server.sendmail(sender_email, receiver_email, message)
def main():
# scrape element from question 3
# The state of the Chartreuse pants, sold out (A) or in stock (B)
driver = webdriver.Firefox(options=firefox_options, executable_path='/class/datamine/apps/geckodriver')
driver.get("https://project4.tdm.wiki/")
# click the "wild colors" button
label = driver.find_element_by_xpath("//label[@for='ui-component-toggle__wild']")
label.click()
element = driver.find_element_by_xpath("//span[@data-color='Chartreuse']/parent::div/following-sibling::div/span")
# does the text indicate it is in stock?
if element.text == "In stock":
# if yes, send email to yourself telling you it is in stock.
send_purdue_email("kamstut@purdue.edu", "MYPASSWORD", "kamstut@purdue.edu")
# otherwise, gracefully end script using the "pass" Python keyword
else:
pass
if __name__ == "__main__":
main()6. Take a look at the byline of each pair of pants (the sentences starting with "Perfect for..."). Inspect the HTML. Try and scrape the text using xpath expressions like you normally would. What happens? Are you able to scrape it? Google around and come up with your best explanation of what is happening.
Relevant topics: pseudo elements
Item(s) to submit:
- Python code used to solve the problem.
- Output from running your code.
- An explanation of what is happening.
Solution
If you try and scrape using an xpath expression and the class attribute, you get no text:
# The state of the Chartreuse pants, sold out (A) or in stock (B)
driver = webdriver.Firefox(options=firefox_options, executable_path='/class/datamine/apps/geckodriver')
driver.get("https://project4.tdm.wiki/")
# click the "wild colors" button
label = driver.find_element_by_xpath("//label[@for='ui-component-toggle__wild']")
label.click()
element = driver.find_element_by_xpath("//span[@class='ui-component-card--desc-amount ui-component-card--desc-amount-2']")
print(element.text)
driver.quit()What is happening is pseudo elements are not part of the DOM -- they are for styling (in this case, using "content" is css). To scrape, you'd need to use a script and css:
# The state of the Chartreuse pants, sold out (A) or in stock (B)
driver = webdriver.Firefox(options=firefox_options, executable_path='/class/datamine/apps/geckodriver')
driver.get("https://project4.tdm.wiki/")
# click the "wild colors" button
label = driver.find_element_by_xpath("//label[@for='ui-component-toggle__wild']")
label.click()
script = "return window.getComputedStyle(document.querySelector('.ui-component-card--desc-amount.ui-component-card--desc-amount-2'),':before').getPropertyValue('content')"
print(driver.execute_script(script).strip())
driver.quit()Project 5
Motivation: One of the best things about learning to scrape data is the many applications of the skill that may pop into your mind. In this project, we want to give you some flexibility to explore your own ideas, but at the same time, add a couple of important tools to your tool set. We hope that you've learned a lot in this series, and can think of creative ways to utilize your new skills.
Context: This is the last project in a series focused on scraping data. We have created a couple of very common scenarios that can be problematic when first learning to scrape data, and we want to show you how to get around them.
Scope: python, web scraping, etc.
Learning objectives:
- Use the requests package to scrape a web page.
- Use the lxml/selenium package to filter and parse data from a scraped web page.
- Learn how to step around header-based filtering.
- Learn how to handle rate limiting.
Make sure to read about, and use the template found here, and the important information about projects submissions here.
Questions
1. It is not uncommon to be blocked from scraping a website. There are a variety of strategies that they use to do this, and in general they work well. In general, if a company wants you to extract information from their website, they will make an API (application programming interface) available for you to use. One method (that is commonly paired with other methods) is blocking your request based on headers. You can read about headers here. In general, you can think of headers as some extra data that gives the server or client context. Here is a list of headers, and some more explanation.
Each header has a purpose. One common header is called the User-Agent header. A User-Agent looks something like:
User-Agent: Mozilla/5.0 (Macintosh; Intel Mac OS X 10.16; rv:86.0) Gecko/20100101 Firefox/86.0You can see headers if you open the console in Firefox or Chrome and load a website. It will look something like:
From the mozilla link, this header is a string that "lets servers and network peers identify the application, operating system, vendor, and/or version of the requesting user agent." Basically, if you are browsing the internet with a common browser, the server will know what you are using. In the provided example, we are using Firefox 86 from Mozilla, on a Mac running Mac OS 10.16 with an Intel processor.
When we send a request from a package like requests in Python, here is what the headers look like:
import requests

response = requests.get("https://project5-headers.tdm.wiki")
print(response.request.headers)
{'User-Agent': 'python-requests/2.25.1', 'Accept-Encoding': 'gzip, deflate', 'Accept': '*/*', 'Connection': 'keep-alive'}As you can see our User-Agent is python-requests/2.25.1. You will find that many websites block requests made from anything such user agents. One such website is: https://project5-headers.tdm.wiki.
Scrape https://project5-headers.tdm.wiki from Scholar and explain what happens. What is the response code, and what does that response code mean? Can you ascertain what you would be seeing (more or less) in a browser based on the text of the response (the actual HTML)? Read this section of the documentation for the headers package, and attempt to "trick" https://project5-headers.tdm.wiki into presenting you with the desired information. The desired information should look something like:
Hostname: c1de5faf1daa
IP: 127.0.0.1
IP: 172.18.0.4
RemoteAddr: 172.18.0.2:34520
GET / HTTP/1.1
Host: project5-headers.tdm.wiki
User-Agent: Mozilla/5.0 (Macintosh; Intel Mac OS X 10.16; rv:86.0) Gecko/20100101 Firefox/86.0
Accept: text/html,application/xhtml+xml,application/xml;q=0.9,image/avif,image/webp,*/*;q=0.8
Accept-Encoding: gzip
Accept-Language: en-US,en;q=0.5
Cdn-Loop: cloudflare
Cf-Connecting-Ip: 107.201.65.5
Cf-Ipcountry: US
Cf-Ray: 62289b90aa55f975-EWR
Cf-Request-Id: 084d3f8e740000f975e0038000000001
Cf-Visitor: {"scheme":"https"}
Cookie: __cfduid=d9df5daa57fae5a4e425173aaaaacbfc91613136177
Dnt: 1
Sec-Gpc: 1
Upgrade-Insecure-Requests: 1
X-Forwarded-For: 123.123.123.123
X-Forwarded-Host: project5-headers.tdm.wiki
X-Forwarded-Port: 443
X-Forwarded-Proto: https
X-Forwarded-Server: 6afe64faffaf
X-Real-Ip: 123.123.123.123Relevant topics: requests
Item(s) to submit:
- Python code used to solve the problem.
- Response code received (a number), and an explanation of what that HTTP response code means.
- What you would (probably) be seeing in a browser if you were blocked.
- Python code used to "trick" the website into being scraped.
- The content of the successfully scraped site.
Solution
import requests

response = requests.get("https://project5-headers.tdm.wiki")
print(response.status_code) # 403

# 403 is an https response code that means the content is forbidden

# based on the HTML it looks like we'd be presented with a CAPTCHA
print(response.text)

# to fix this, let's change our User-Agent header
response = requests.get("https://project5-headers.tdm.wiki", headers={"User-Agent": "anything"})
print(response.text)

# or even better, would be to "fake" a browser
response = requests.get("https://project5-headers.tdm.wiki", headers={"User-Agent": "Mozilla/5.0 (Macintosh; Intel Mac OS X 10.16; rv:86.0) Gecko/20100101 Firefox/86.0"})
print(response.text)The following function tries to scrape the Cf-Request-Id header which will have a unique value each request:
import requests
import lxml.html

def scrape_cf_request_id(url):
    resp = requests.get(url)
    tree = lxml.html.fromstring(resp.text)
    content = tree.xpath("//p")[0].text.split('\n')
    cfid = [l for l in content if 'Cf-Request-Id' in l][0].split()[1]
    return cfid
You can test it out:
scrape_cf_request_id("https://project5-rate-limit.tdm.wiki")Write code to scrape 10 unique Cf-Request-Ids (in a loop), and save them to a list called my_ids. What happens when you run the code? This is caused by our expected text not being present. Instead text with "Too Many Requests" is. While normally this error would be something that makes more sense, like an HTTPError or a Timeout Exception, it could be anything, depending on your code.
One solution that might come to mind is to "wait" between each loop using time.sleep(). While yes, this may work, it is not a robust solution. Other users from your IP address may count towards your rate limit and cause your function to fail, the amount of sleep time may change dynamically, or even be manually adjusted to be longer, etc. The best way to handle this is to used something called exponential backoff.
In a nutshell, exponential backoff is a way to increase the wait time (exponentially) until an acceptable rate is found. backoff is an excellent package to do just that. backoff, upon being triggered from a specified error or exception, will wait to "try again" until a certain amount of time has passed. Upon receving the same error or exception, the time to wait will increase exponentially. Use backoff to modify the provided scrape_cf_request_id function to use exponential backoff when the we alluded to occurs. Test out the modified function in a loop and print the resulting 10 Cf-Request-Ids.
Note: backoff utilizes decorators. For those interested in learning about decorators, this is an excellent article.
Relevant topics: requests
Item(s) to submit:
- Python code used to solve the problem.
- What happens when you run the function 10 times in a row?
- Fixed code that will work regardless of the rate limiting.
-
10 unique
Cf-Request-Ids printed.
Solution
import requests
import lxml.html

# function to scrape the Cf-Request-Id
def scrape_cf_request_id(url):
    resp = requests.get(url)
    tree = lxml.html.fromstring(resp.text)
    content = tree.xpath("//p")[0].text.split('\n')
    cfid = [l for l in content if 'Cf-Request-Id' in l][0].split()[1]
    print(cfid)

my_list = []
for i in range(10):
    my_list.append(scrape_cf_request_id("https://project5-rate-limit.tdm.wiki"))
This will cause an IndexError because the expected content containing the Cf-Request-Id is not present, instead "Too Many Requests" is.
import backoff
from lxml import etree

@backoff.on_exception(backoff.expo,
                      IndexError)
def scrape_cf_request_id(url):
    resp = requests.get(url, headers={"User-Agent": "something"})
    tree = lxml.html.fromstring(resp.text)
    content = tree.xpath("//p")[0].text.split('\n')
    cfid = [l for l in content if 'Cf-Request-Id' in l][0].split()[1]
    print(cfid)

my_list = []
for i in range(10):
    my_list.append(scrape_cf_request_id("https://project5-rate-limit.tdm.wiki"))

print(my_list)
3. You now have a great set of tools to be able to scrape pretty much anything you want from the internet. Now all that is left to do is practice. Find a course appropriate website containing data you would like to scrape. Utilize the tools you've learned about to scrape at least 100 "units" of data. A "unit" is just a representation of what you are scraping. For example, a unit could be a tweet from Twitter, a basketball player's statistics from sportsreference, a product from Amazon, a blog post from your favorite blogger, etc.
The hard requirements are:
- Documented code with thorough comments explaining what the code does.
- At least 100 "units" scraped.
- The data must be from multiple web pages.
- Write at least 1 function (with a docstring) to help you scrape.
- A clear explanation of what your scraper scrapes, challenges you encountered (if any) and how you overcame them, and a sample of your data printed out (for example a
headof a pandas dataframe containing the data).
Item(s) to submit:
- Python code that scrapes 100 unites of data (with thorough comments explaining what the code does).
- The data must be from more than a single web page.
- 1 or more functions (with docstrings) used to help you scrape/parse data.
-
Clear documentation and explanation of what your scraper scrapes, challenges you encountered (if any) and how you overcame them, and a sample of your data printed out (for example using the
headof a dataframe containing the data).
Solution
- Python code with comments
- Sample of scraped data (must be from multiple pages)
- At least 100 "units" of scraped data (for example 1 tweet == 1 unit, 1 product from amazon == 1 unit, etc.)
- At least 1 helper function with a docstring
- A paragraph explaining things
Project 6
Motivation: Being able to analyze and create good visualizations is a skill that is invaluable in many fields. It can be pretty fun too! In this project, you can pick and choose if a couple of different plotting projects.
Context: We've been working hard all semester, learning a lot about web scraping. In this project, you are given the choice between a project designed to go through some matplotlib basics, and a project that has you replicate plots from a book using plotly (an interactive plotting package) inside a Jupyter Notebook (which you would submit instead of an RMarkdown file).
Scope: python, visualizing data
Learning objectives:
- Demostrate the ability to create basic graphs with default settings.
- Demonstrate the ability to modify axes labels and titles.
- Demonstrate the ability to customize a plot (color, shape/linetype).
Make sure to read about, and use the template found here, and the important information about projects submissions here.
Option 2
1. Here are a variety of interesting graphics from the popular book Displaying time series, spatial and space-time data with R by Oscar Perpinan Lamigueiro. You can replicate the graphics using data found here.
Choose 3 graphics from the book to replicate using plotly. The replications do not need to be perfect -- a strong effort to get as close as possible is fine. Feel free to change colors as you please. If you have the desire to improve the graphic, please feel free to do so and explain how it is an improvement.
Use https://notebook.scholar.rcac.purdue.edu and the f2020-s2021 kernel to complete this project. The only thing you need to submit for this project is the downloaded .ipynb file. Make sure that the grader will be able to click "run all" (using the same kernel, f2020-s2021), and have everything run properly.
Important note: The object of this project is to challenge yourself (as much as you want), learn about and mess around with plotly, and be creative. If you have an idea for a cool plot, graphic, or modification, please include it!
Item(s) to submit:
- Python code used to solve the problem.
- Output from running your code.
Project 7
Motivation: Being able to analyze and create good visualizations is a skill that is invaluable in many fields. It can be pretty fun too! As you probably noticed in the previous project, matplotlib can be finicky -- certain types of plots are really easy to create, while others are not. For example, you would think changing the color of a boxplot would be easy to do in matplotlib, perhaps we just need to add an option to the function call. As it turns out, this isn't so straightforward (as illustrated at the end of this section). Occasionally this will happen and that is when packages like seaborn or plotnine (both are packages built using matplotlib) can be good. In this project we will explore this a little bit, and learn about some useful pandas functions to help shape your data in a format that any given package requires.
Context: In the next project, we will continue to learn about and become comfortable using matplotlib, seaborn, and plotnine.
Scope: python, visualizing data
Learning objectives:
- Demonstrate the ability to create basic graphs with default settings.
- Demonstrate the ability to modify axes labels and titles.
- Demonstrate the ability to customize a plot (color, shape/linetype).
Make sure to read about, and use the template found here, and the important information about projects submissions here.
Dataset
The following questions will use the dataset found in Scholar:
/class/datamine/data/apple/health/watch_dump.xml
Questions
2. The plot in question 1 should look bimodal. Let's focus only on the first apparent group of readings. Create a new dataframe containing only the readings for the time period from 9/1/2017 to 5/31/2019. How many Records are there in that time period?
Relevant topics: lxml, groupby, barplot
Item(s) to submit:
- Python code used to solve the problem.
- Output from running your code.
3. It is hard to discern weekly patterns (if any) based on the graphics created so far. For the period of time in question 2, create a labeled bar plot for the count of Records by day of the week. What (if any) discernable patterns are there? Make sure to include the labels provided below:
labels = ["Mon", "Tue", "Wed", "Thu", "Fri", "Sat", "Sun"]Relevant topics: lxml, groupby, barplot
Item(s) to submit:
- Python code used to solve the problem.
- Output from running your code (including the graphic).
4. Create a pandas dataframe containing the following data from watch_dump.xml:
- A column called
bpmwith thebpm(beats per minute) of theInstantaneousBeatsPerMinute. - A column called
timewith thetimeof each individualbpmreading inInstantaneousBeatsPerMinute. - A column called
datewith the date. - A column called
dayofweekwith the day of the week.
Hint: You may want to use pd.to_numeric to convert the bpm column to a numeric type.
Hint: This is one way to convert the numbers 0-6 to days of the week:
myDF['dayofweek'] = myDF['dayofweek'].map({0:"Mon", 1:"Tue", 2:"Wed", 3:"Thu", 4:"Fri", 5: "Sat", 6: "Sun"})Relevant topics: lxml, groupby, barplot
Item(s) to submit:
- Python code used to solve the problem.
- Output from running your code.
5. Create a heatmap using seaborn, where the y-axis shows the day of the week ("Mon" - "Sun"), the x-axis shows the hour, and the values on the interior of the plot are the average bpm by hour by day of the week.
Relevant topics: lxml, groupby, pivot
Item(s) to submit:
- Python code used to solve the problem.
- Output from running your code (including the graphic).
Project 8
Motivation: Python is an interpreted language (as opposed to a compiled language). In a compiled language, you are (mostly) unable to run and evaluate a single instruction at a time. In Python (and R -- also an interpreted language), we can run and evaluate a line of code easily using a repl. In fact, this is the way you've been using Python to date -- selecting and running pieces of Python code. Other ways to use Python include creating a package (like numpy, pandas, and pytorch), and creating scripts. You can create powerful CLI's (command line interface) tools using Python. In this project, we will explore this in detail and learn how to create scripts that accept options and input and perform tasks.
Context: This is the first (of two) projects where we will learn about creating and using Python scripts.
Scope: python
Learning objectives:
- Write a python script that accepts user inputs and returns something useful.
Make sure to read about, and use the template found here, and the important information about projects submissions here.
Questions
1. Often times the deliverable part of a project isn’t custom built packages or modules, but a script. A script is a .py file with python code written inside to perform action(s). Python scripts are incredibly easy to run, for example, if you had a python script called question01.py, you could run it by opening a terminal and typing:
python3 /path/to/question01.pyThe python interpreter then looks for the scripts entrypoint, and starts executing. You should read this article about the main function and python scripts. In addition, read this section, paying special attention to the shebang.
Create a Python script called question01.py in your $HOME directory. Use the second shebang from the article: #!/usr/bin/env python3. When run, question01.py should use the sys package to print the location of the interpreter being used to run the script. For example, if we started a Python interpreter in RStudio using the following code:
datamine_py()
reticulate::repl_python()
Then, we could print the interpreter by running the following Python code one line at a time:
import sys
print(sys.executable)
Since we are using our Python environment, you should see this result: /class/datamine/apps/python/f2020-s2021/env/bin/python3. This is the fully qualified path of the Python interpreter we've been using for this course.
2. Was your output in question (1) expected? Why or why not?
When we restarted the R session, our datamine_py's effects were reversed, and the default Python interpreter is no longer our default when running python3. It is very common to have a multitude of Python environments available to use. But, when we are running a Python script it is not convenient to have to run various commands (in our case, the single datamine_py command) in order to get our script to run the way we want it to run. In addition, if our script used a set of packages that were not installed outside of our course environment, the script would fail.
In this project, since our focus is more on how to write scripts and make them work as expected, we will have some fun and experiment with some pre-trained state of the art machine learning models.
The following function accepts a string called sentence as an input and returns the sentiment of the sentence, "POSITIVE" or "NEGATIVE".
from transformers import pipeline

def get_sentiment(model, sentence: str) -> str:
    result = model(sentence)

    return result[0].get('label')

model = pipeline('sentiment-analysis')

print(get_sentiment(model, 'This is really great!'))
print(get_sentiment(model, 'Oh no! Thats horrible!'))
Include get_sentiment (including the import statement) in a new script, question02.py script. Note that you do not have to use get_sentiment anywhere, just include it for now. Go to the terminal in RStudio and execute your script. What happens?
Remember, since our current shebang is #!/usr/bin/env python3, if our script uses one or more packages that are not installed in the current environment environment, the script will fail. This is what is happening. The transformers package that we use is not installed in the current environment. We do, however, have an environment that does have it installed, and it is located on Scholar at: /class/datamine/apps/python/pytorch2021/env/bin/python. Update the script's shebang and try to run it again. Does it work now?
Explanation: Depending on the state of your current environment, the original shebang, #!/usr/bin/env python3 will use the same Python interpreter and environment that is currently set to python3 (run which python3 to see). If you haven't run datamine_py, this will be something like: /apps/spack/scholar/fall20/apps/anaconda/2020.11-py38-gcc-4.8.5-djkvkvk/bin/python or /usr/bin/python, if you have run datamine_py, this will be: /class/datamine/apps/python/f2020-s2021/env/bin/python. Both environments lack the transformers package. Our other environment whose interpreter lives here: /class/datamine/apps/python/pytorch2021/env/bin/python does have this package. The shebang is then critically important for any scripts that want to utilize packages from a specific environment.
Important note: You can run bash code using a bash code chunk just like you would an R or Python code chunk. Simply replace "python" with "bash" in the code chunk options.
Relevant topics: writing scripts
Item(s) to submit:
- Sentence explaining why or why not the output from question (1) was expected.
-
Sentence explaining what happens when you include
get_sentimentin your script and try to execute it. - The entirety of the updated (working) script's content in a Python code chunk with chunk option "eval=F".
3. Okay, great. We now understand that if we want to use packages from a specific environment, we need to modify our shebang accordingly. As it currently stands, our script is pretty useless. Modify the script, in a new script called question03.py to accept a single argument. This argument should be a sentence. Your script should then print the sentence, and whether or not the sentence is "POSITIVE" or "NEGATIVE". Use sys.argv to accomplish this. Make sure the script functions in the following way:
$HOME/question03.py This is a happy sentence, yay!Too many arguments.$HOME/question03.py 'This is a happy sentence, yay!'Our sentence is: This is a happy sentence, yay!
POSITIVE$HOME/question03.py./question03.py requires at least 1 argument, "sentence".Hint: One really useful way to exit the script and print a message is like this:
import sys

sys.exit(f"{__file__} requires at least 1 argument, 'sentence'")
Important note: You can run bash code using a bash code chunk just like you would an R or Python code chunk. Simply replace "python" with "bash" in the code chunk options.
Relevant topics: writing scripts
Item(s) to submit:
- The entirety of the updated (working) script's content in a Python code chunk with chunk option "eval=F".
- Output from running your script with the given examples.
4. If you look at the man pages for a command line tool like awk or grep (you can get these by running man awk or man grep in the terminal), you will see that typically CLI's have a variety of options. Options usually follow the following format:
grep -i 'ok' some_file.txtHowever, often times you have 2 ways you can use an option -- either with the short form (for example -i), or long form (for example -i is the same as --ignore-case). Sometimes options can get values. If options don't have values, you can assume that the presence of the flag means TRUE and the lack means FALSE. When using short form, the value for the option is separated by a space (for example grep -f my_file.txt). When using long form, the value for the option is separated by an equals sign (for example grep --file=my_file.txt).
Modify your script (as a new question04.py) to include an option called score. When active (question04.py --score or question04.py -s), the script should return both the sentiment, "POSITIVE" or "NEGATIVE" and the probability of being accurate. Make sure that you modify your checks from question 3 to continue to work whenever we use --score or -s. Some examples below:
$HOME/question04.py 'This is a happy sentence, yay!'Our sentence is: This is a happy sentence, yay!
POSITIVE$HOME/question04.py --score 'This is a happy sentence, yay!'Our sentence is: This is a happy sentence, yay!
POSITIVE: 0.999848484992981$HOME/question04.py -s 'This is a happy sentence, yay!'Our sentence is: This is a happy sentence, yay!
POSITIVE: 0.999848484992981$HOME/question04.py 'This is a happy sentence, yay!' -sOur sentence is: This is a happy sentence, yay!
POSITIVE: 0.999848484992981$HOME/question04.py 'This is a happy sentence, yay!' --scoreOur sentence is: This is a happy sentence, yay!
POSITIVE: 0.999848484992981$HOME/question04.py 'This is a happy sentence, yay!' --valueUnknown option(s): ['--value']$HOME/question04.py 'This is a happy sentence, yay!' --value --scoreToo many arguments.$HOME/question04.pyquestion04.py requires at least 1 argument, "sentence"$HOME/question04.py --score./question04.py requires at least 1 argument, "sentence". No sentence provided.$HOME/question04.py 'This is one sentence' 'This is another'./question04.py requires only 1 sentence, but 2 were provided.Important note: You can run bash code using a bash code chunk just like you would an R or Python code chunk. Simply replace "python" with "bash" in the code chunk options.
Hint: Experiment with the provided function. You will find the probability of being accurate is already returned by the model.
Relevant topics: writing scripts
Item(s) to submit:
- The entirety of the updated (working) script's content in a Python code chunk with chunk option "eval=F".
- Output from running your script with the given examples.
5. Wow, that is an extensive amount of logic for for a single option. Luckily, Python has the argparse package to help you build CLI's and handle situations like this. You can find the documentation for argparse here and a nice little tutorial here. Update your script (as a new question05.py) using argparse instead of custom logic. Specifically, add 1 positional argument called "sentence", and 1 optional argument "--score" or "-s". You should handle the following scenarios:
$HOME/question05.py 'This is a happy sentence, yay!'Our sentence is: This is a happy sentence, yay!
POSITIVE$HOME/question05.py --score 'This is a happy sentence, yay!'Our sentence is: This is a happy sentence, yay!
POSITIVE: 0.999848484992981$HOME/question05.py -s 'This is a happy sentence, yay!'Our sentence is: This is a happy sentence, yay!
POSITIVE: 0.999848484992981$HOME/question05.py 'This is a happy sentence, yay!' -sOur sentence is: This is a happy sentence, yay!
POSITIVE: 0.999848484992981$HOME/question05.py 'This is a happy sentence, yay!' --scoreOur sentence is: This is a happy sentence, yay!
POSITIVE: 0.999848484992981$HOME/question05.py 'This is a happy sentence, yay!' --valueusage: question05.py [-h] [-s] sentence
question05.py: error: unrecognized arguments: --value$HOME/question05.py 'This is a happy sentence, yay!' --value --scoreusage: question05.py [-h] [-s] sentence
question05.py: error: unrecognized arguments: --value$HOME/question05.pyusage: question05.py [-h] [-s] sentence
positional arguments:
sentence
optional arguments:
-h, --help show this help message and exit
-s, --score display the probability of accuracy$HOME/question05.py --scoreusage: question05.py [-h] [-s] sentence
question05.py: error: too few arguments$HOME/question05.py 'This is one sentence' 'This is another'usage: question05.py [-h] [-s] sentence
question05.py: error: unrecognized arguments: This is anotherHint: A good way to print the help information if no arguments are provided is:
if len(sys.argv) == 1:
    parser.print_help()
    parser.exit()
Important note: Include the bash code chunk option error=T to enable RMarkdown to knit and output errors.
Important note: You can run bash code using a bash code chunk just like you would an R or Python code chunk. Simply replace "python" with "bash" in the code chunk options.
Relevant topics: writing scripts, argparse
Item(s) to submit:
- Python code used to solve the problem.
- Output from running your code.
Project 9
Motivation: In the previous project you worked through some common logic needed to make a good script. By the end of the project argparse was (hopefully) a welcome package to be able to use. In this project, we are going to continue to learn about argparse and create a CLI for the WHIN Data Portal. In doing so, not only will we get to practice using argparse, but you will also get to learn about using an API to retrieve data. An API (application programming interface) is a common way to retrieve structured data from a company or resource. It is common for large companies like Twitter, Facebook, Google, etc. to make certain data available via API's, so it is important to get some exposure.
Context: This is the second (of two) projects where we will learn about creating and using Python scripts.
Scope: python
Learning objectives:
- Write a python script that accepts user inputs and returns something useful.
- Interact with an API to retrieve data.
Make sure to read about, and use the template found here, and the important information about projects submissions here.
Dataset
The following questions will involve retrieving data using an API. Instructions and hints will be provided as we go.
Questions
1. WHIN (Wabash Heartland Innovation Network) has deployed hundreds of weather stations across the region so farmers can use the data collected to become more efficient, save time, and increase yields. WHIN has kindly granted access to 20+ public-facing weather stations for educational purposes.
Navigate to https://data.whin.org/data/current-conditions, and click on the "CREATE ACCOUNT" button in the middle of the screen:
Click on "I'm a student or educator":
Enter your information. For "School or Organization" please enter "Purdue University". For "Class or project", please put "The Data Mine Project 9". For the description, please put "We are learning about writing scripts by writing a CLI to fetch data from the WHIN API." Please use your purdue.edu email address. Once complete, click "Next".
Read about the API under "API Usage". An endpoint is the place (in this case the end of a URL (which can be referred to as the URI)) that you can use to access/delete/update/etc. a given resource depending on the HTTP method used. What are the 3 endpoints of this API?
Write and run a script called question01.py that, when run, tries to print the current listing of the weather stations. Instead of printing what you think it should print, it will print something else. What happened?
$HOME/question01.pyHint: You can use the requests library to run the HTTP GET method on the endpoint. For example:
import requests

response = requests.get("https://datamine.purdue.edu/")
print(response.json())
Hint: We want to use our regular course environment, therefore, make sure to use the following shebang: #!/class/datamine/apps/python/f2020-s2021/env/bin/python
Relevant topics: writing scripts
Item(s) to submit:
- List the 3 endpoints for this API.
- The entirety of the updated (working) script's content in a Python code chunk with chunk option "eval=F".
- Output from running your script with the given examples.
Update your script (as a new script called question02.py), and test it out again to see if we get the expected results now. question02.py should only print the first 5 results.
A couple important notes:
- The bearer token should be taken care of like a password. You do NOT want to share this, ever.
- There is an inherent risk in saving code like the code shown above. What if you accidentally upload it to GitHub? Then anyone with access could potentially read and use your token.
In this file, replace the "aslgdkj..." part with you actual token and save the file. Then make sure only YOU can read and write to this file by running the following in a terminal:
chmod 600 $HOME/.envNow, we can use a package called dotenv to load the variables in the $HOME/.env file into the environment. We can then use the os package to get the environment variables. For example:
import os
from dotenv import load_dotenv

# This function will load the .env file variables from the same directory as the script into the environment
load_dotenv()

# We can now use os.getenv to get the important information without showing anything.
# Now, all anybody reading the code sees is "os.getenv('MY_BEARER_TOKEN')" even though that is replaced by the actual
# token when the code is run, cool!
my_headers = {"Authorization": f"Bearer {os.getenv('MY_BEARER_TOKEN')}"}
Update question02.py to use dotenv and os.getenv to get the token from the local $HOME/.env file. Test out your script:
$HOME/question02.py Relevant topics: writing scripts
Item(s) to submit:
- The entirety of the updated (working) script's content in a Python code chunk with chunk option "eval=F".
- Output from running your script with the given example.
3. That's not so bad! We now know how to retrieve data from the API as well as load up variables from our environment rather than insecurely just pasting them in our code, great!
A query parameter is (more or less) some extra information added at the end of the endpoint. For example, the following url has a query parameter called param and value called value: https://example.com/some_resource?param=value. You could even add more than one query parameter as follows: https://example.com/some_resource?param=value&second_param=second_value -- as you can see, now we have another parameter called second_param with a value of second_value. While the query parameters begin with a ?, each subsequent parameter is added using &.
Query parameters can be optional or required. API's will sometimes utilize query parameters to filter or fine-tune the returned results. Look at the documentation for the /api/weather/station-daily endpoint. Use your newfound knowledge of query parameters to update your script (as a new script called question03.py) to retrieve the data for station with id 150 on 2021-01-05, and print the first 5 results. Test out your script:
$HOME/question03.pyRelevant topics: writing scripts
Item(s) to submit:
- The entirety of the updated (working) script's content in a Python code chunk with chunk option "eval=F".
- Output from running your script with the given example.
4. Excellent, now let's build our CLI. Call the script whin.py. Use your knowledge of requests, argparse, and API's to write a CLI that replicates the behavior shown below. For convenience, only print the first 2 results for all output.
Hints:
- In general, there will be 3 commands:
stations,daily, andcc(for current condition). - You will want to create a subparser for each command:
stations_parser,current_conditions_parser, anddaily_parser. - The
daily_parserwill have 2 position, required arguments:station_idanddate. - The
current_conditions_parserwill have 2 optional arguments of typestr:--center/-cand--radius/-r. - If only one of
--centeror--radiusis present, you should usesys.exitto print a message saying "Need both center AND radius, or neither.". - To create a subparser, just do the following:
parser = argparse.ArgumentParser()
subparsers = parser.add_subparsers(help="possible commands", dest="command")

my_subparser = subparsers.add_parser("my_command", help="my help message")
my_subparser.add_argument("--my-option", type=str, help="some option")

args = parser.parse_args()- Then, you can access which command was run with
args.command(which in this case would only have 1 possible value ofmy_command), and access any parser or subparsers options withargs, for example,args.my_option.
$HOME/whin.pyusage: whin.py [-h] {stations,cc,daily} ...
positional arguments:
{stations,cc,daily} possible commands
stations list the stations
cc list the most recent data from each weather station
daily list data from a given day and station
optional arguments:
-h, --help show this help message and exitHint: A good way to print the help information if no arguments are provided is:
if len(sys.argv) == 1:
    parser.print_help()
parser.exit()$HOME/whin.py stations -husage: whin.py stations [-h]
optional arguments:
-h, --help show this help message and exit$HOME/whin.py cc -husage: whin.py cc [-h] [-c CENTER] [-r RADIUS]
optional arguments:
-h, --help show this help message and exit
-c CENTER, --center CENTER
return results near this center coordinate, given as a
latitude,longitude pair
-r RADIUS, --radius RADIUS
search distance, in meters, from the center$HOME/whin.py cc[{'humidity': 90, 'latitude': 40.93894, 'longitude': -86.47418, 'name': 'WHIN001-PULA001', 'observation_time': '2021-03-16T18:45:00Z', 'pressure': '30.051', 'rain': '0', 'rain_inches_last_hour': '0', 'soil_moist_1': 6, 'soil_moist_2': 11, 'soil_moist_3': 14, 'soil_moist_4': 9, 'soil_temp_1': 42, 'soil_temp_2': 40, 'soil_temp_3': 40, 'soil_temp_4': 41, 'solar_radiation': 203, 'solar_radiation_high': 244, 'station_id': 1, 'temperature': 40, 'temperature_high': 40, 'temperature_low': 40, 'wind_direction_degrees': '337.5', 'wind_gust_direction_degrees': '22.5', 'wind_gust_speed_mph': 6, 'wind_speed_mph': 3}, {'humidity': 88, 'latitude': 40.73083, 'longitude': -86.98467, 'name': 'WHIN003-WHIT001', 'observation_time': '2021-03-16T18:45:00Z', 'pressure': '30.051', 'rain': '0', 'rain_inches_last_hour': '0', 'soil_moist_1': 6, 'soil_moist_2': 5, 'soil_moist_3': 6, 'soil_moist_4': 4, 'soil_temp_1': 40, 'soil_temp_2': 39, 'soil_temp_3': 39, 'soil_temp_4': 40, 'solar_radiation': 156, 'solar_radiation_high': 171, 'station_id': 3, 'temperature': 40, 'temperature_high': 40, 'temperature_low': 39, 'wind_direction_degrees': '337.5', 'wind_gust_direction_degrees': '337.5', 'wind_gust_speed_mph': 8, 'wind_speed_mph': 3}]Important note: Your values may be different because they are current conditions.
$HOME/whin.py cc --radius=10000Need both center AND radius, or neither.$HOME/whin.py cc --center=40.4258686,-86.9080654Need both center AND radius, or neither.$HOME/whin.py cc --center=40.4258686,-86.9080654 --radius=10000[{'humidity': 86, 'latitude': 40.42919, 'longitude': -86.84547, 'name': 'WHIN008-TIPP005 Chatham Square', 'observation_time': '2021-03-16T18:45:00Z', 'pressure': '30.012', 'rain': '0', 'rain_inches_last_hour': '0', 'soil_moist_1': 5, 'soil_moist_2': 5, 'soil_moist_3': 5, 'soil_moist_4': 5, 'soil_temp_1': 42, 'soil_temp_2': 41, 'soil_temp_3': 41, 'soil_temp_4': 42, 'solar_radiation': 191, 'solar_radiation_high': 220, 'station_id': 8, 'temperature': 42, 'temperature_high': 42, 'temperature_low': 42, 'wind_direction_degrees': '0', 'wind_gust_direction_degrees': '22.5', 'wind_gust_speed_mph': 9, 'wind_speed_mph': 3}, {'humidity': 86, 'latitude': 40.38494, 'longitude': -86.84577, 'name': 'WHIN027-TIPP003 EXT', 'observation_time': '2021-03-16T18:45:00Z', 'pressure': '29.515', 'rain': '0', 'rain_inches_last_hour': '0', 'soil_moist_1': 5, 'soil_moist_2': 4, 'soil_moist_3': 4, 'soil_moist_4': 5, 'soil_temp_1': 43, 'soil_temp_2': 42, 'soil_temp_3': 42, 'soil_temp_4': 42, 'solar_radiation': 221, 'solar_radiation_high': 244, 'station_id': 27, 'temperature': 43, 'temperature_high': 43, 'temperature_low': 43, 'wind_direction_degrees': '337.5', 'wind_gust_direction_degrees': '337.5', 'wind_gust_speed_mph': 6, 'wind_speed_mph': 3}]$HOME/whin.py dailyusage: whin.py daily [-h] station_id date
whin.py daily: error: too few arguments$HOME/whin.py daily 150 2021-01-05[{'humidity': 96, 'latitude': 41.00467, 'longitude': -86.68428, 'name': 'WHIN058-PULA007', 'observation_time': '2021-01-05T05:00:00Z', 'pressure': '29.213', 'rain': '0', 'rain_inches_last_hour': '0', 'soil_moist_1': 5, 'soil_moist_2': 6, 'soil_moist_3': 7, 'soil_moist_4': 5, 'soil_temp_1': 33, 'soil_temp_2': 34, 'soil_temp_3': 35, 'soil_temp_4': 35, 'solar_radiation': 0, 'solar_radiation_high': 0, 'station_id': 150, 'temperature': 31, 'temperature_high': 31, 'temperature_low': 31, 'wind_direction_degrees': '270', 'wind_gust_direction_degrees': '292.5', 'wind_gust_speed_mph': 13, 'wind_speed_mph': 8}, {'humidity': 96, 'latitude': 41.00467, 'longitude': -86.68428, 'name': 'WHIN058-PULA007', 'observation_time': '2021-01-05T05:15:00Z', 'pressure': '29.207', 'rain': '1', 'rain_inches_last_hour': '0', 'soil_moist_1': 5, 'soil_moist_2': 6, 'soil_moist_3': 7, 'soil_moist_4': 5, 'soil_temp_1': 33, 'soil_temp_2': 34, 'soil_temp_3': 35, 'soil_temp_4': 35, 'solar_radiation': 0, 'solar_radiation_high': 0, 'station_id': 150, 'temperature': 31, 'temperature_high': 31, 'temperature_low': 31, 'wind_direction_degrees': '270', 'wind_gust_direction_degrees': '292.5', 'wind_gust_speed_mph': 14, 'wind_speed_mph': 9}]Relevant topics: writing scripts
Item(s) to submit:
- The entirety of the updated (working) script's content in a Python code chunk with chunk option "eval=F".
- Output from running your script with the given examples.
5. There are a multitude of improvements and/or features that we could add to whin.py. Customize your script (as a new script called question05.py), to either do something new, or fix a scenario that wasn't covered in question 4. Be sure to include 1-2 sentences that explains exactly what your modification does. Demonstrate the feature by running it in a bash code chunk.
Relevant topics: writing scripts
Item(s) to submit:
- The entirety of the updated (working) script's content in a Python code chunk with chunk option "eval=F".
- Output from running your script with the given examples.
Project 10
Motivation: The use of a suite of packages referred to as the tidyverse is popular with many R users. It is apparent just by looking at tidyverse R code, that it varies greatly in style from typical R code. It is useful to gain some familiarity with this collection of packages, in case you run into a situation where these packages are needed -- you may even find that you enjoy using them!
Context: We've covered a lot of ground so far this semester, and almost completely using Python. In this next series of projects we are going to switch back to R with a strong focus on the tidyverse (including ggplot) and data wrangling tasks.
Scope: R, tidyverse, ggplot
Learning objectives:
- Explain the differences between regular data frames and tibbles.
- Use mutate, pivot, unite, filter, and arrange to wrangle data and solve data-driven problems.
- Combine different data using joins (left_join, right_join, semi_join, anti_join), and bind_rows.
- Group data and calculate aggregated statistics using group_by, mutate, and transform functions.
-
Demonstrate the ability to create basic graphs with default settings, in
ggplot. - Demonstrate the ability to modify axes labels and titles.
Make sure to read about, and use the template found here, and the important information about projects submissions here.
The tidyverse consists of a variety of packages, including, but not limited to: ggplot2, dplyr, tidyr, readr, purrr, tibble, stringr, and lubridate.
One of the underlying premises of the tidyverse is getting the data to be tidy. You can read a lot more about this in Hadley Wickham's excellent book, R for Data Science.
There is an excellent graphic here that illustrates a general workflow for data science projects:
- Import
- Tidy
- Iterate on, to gain understanding:
- Transform
- Visualize
- Model
- Communicate
This is a good general outline of how a project could be organized, but depending on the project or company, this could vary greatly and change as the goals of a project change.
Dataset
The following questions will use the dataset found in Scholar:
/class/datamine/data/okcupid/filtered/*.csv
1. Let's (more or less) follow the guidelines given above. The first step is to import the data. There are two files: questions.csv, and users.csv. Read this section, and use what you learn to read in the two files into questions and users, respectively. Which functions from the tidyverse did you use and why?
Hint: Its easy to load up the tidyverse packages:
library(tidyverse)Hint: Just because a file has the .csv extension does not mean that is it comma separated.
Hint: Make sure to print the tibbles after reading them in to ensure that they were read in correctly. If they were not, use a different function (from tidyverse) to read in the data.
Hint: questions should be 2281x10 and users should be 68371 x 2284
Item(s) to submit:
- R code used to solve the problem.
-
headof each dataset,usersandquestions. -
1 sentence explaining which functions you used (from
tidyverse) and why.
2. You may recall that the function read.csv from base R reads data into a data.frame by default. In the tidyverse, readr's functions read the data into a tibble's, instead. Read this section. To summarize, some important features that are true for tibble's but not necessarily for data.frames are:
- Non-syntactic variable names (surrounded by backticks
`) - Never changes the type of the inputs (for example converting strings to factors)
- More informative output from printing
- No partial matching
- Simple subsetting
Great, the next step in our outline is to make the data "tidy". Read this section. Okay, let's say, for instance, that we wanted to create a tibble with the following columns: user, question, question_text, selected_option, race, gender2, gender_orientation, n, and keywords. As you can imagine, the "tidy" format, while great for analysis, would not be great for storage as there would be a row for each question for each user, at least. Columns like gender2 and race don't change for a user, so we end up with a lot of repeated values.
Okay, we don't need to analyze all 68000 users at once, let's instead, take a random sample of 2200 users, and create a "tidy" tibble as described above. After all, we want to see why this format is useful! While trying to figure out how to do this may seem daunting at first, it is actually not so bad:
First, we convert the users tibble to long form, so each row represents 1 answer to 1 questions from 1 user:
# Add an "id" columns to the users data
users$id <- 1:nrow(users)
# To ensure we get the same random sample, run the set.seed line
# before every time you run the following line
set.seed(12345)
columns_to_pivot <- 1:2278
users_sample_long <- users[sample(nrow(users), 2200),] %>%
    mutate_at(columns_to_pivot, as.character) %>%  # This converts all of our columns in columns_to_pivot to strings
    pivot_longer(cols = columns_to_pivot, names_to="question", values_to = "selected_option") # The old qXXXX columns are now values in the "question" column.
Next, we want to merge our data from the questions tibble with our users_sample_long tibble, into a new table we will call myDF. How many rows and columns are in myDF?
myDF <- merge(users_sample_long, questions, by.x = "question", by.y = "X")Challenge: (0 pts, for fun) If you are looking for a challenge, try to do this in excel or without tidyverse.
Item(s) to submit:
- R code used to solve the problem.
-
The number of rows and columns in
myDF. -
The
headofmyDF.
3. Excellent! Now, we have a nice tidy dataset that we can work with. You may have noticed some odd syntax %>% in the code provided in the previous question. %>% is the piping operator in R added by the magittr package. It works pretty much just like | does in bash. It "feeds" the output from the previous bit of code to the next bit of code. It is extremely common practice to use this operator in the tidyverse.
Observe the head of myDF. Notice how our question column has the value d_age, text has the content "Age", and selected_option (the column that shows the "answer" the user gave), has the actual age of the user. Wouldn't it be better if our myDF had a new column called age instead of age being an answer to a question?
Modify the code provided in question 2 so age ends up being a column in myDF with the value being the actual age of the user.
Hint: Pay close attention to pivot_longer. You will need to understand what this function is doing to fix this.
Hint: You can make a single modification to 1 line to accomplish this. Pay close attention to the cols option in pivot_longer. If you include a column in cols what happens? If you exclude a columns from cols what happens? Experiment on the following tibble, using different values for cols, as well as names_to, and values_to:
myDF <- tibble(
    x=1:3,
    y=1,
    question1=c("How", "What", "Why"),
    question2=c("Really", "You sure", "When"),
    question3=c("Who", "Seriously", "Right now")
)Hint: You can make a single modification to 1 line to accomplish this.
Challenge: (0 pts, for fun) If you are looking for a challenge, try to do this in excel or without tidyverse.
Relevant topics: Negative Indexing, which
Item(s) to submit:
- R code used to solve the problem.
-
The number of rows and columns in
myDF. -
The
headofmyDF.
4. Wow! That is pretty powerful! Okay, it is clear that there are question questions, where the column starts with "q", and other questions, where the column starts with something else. Modify question (3) so all of the questions that don't start with "q" have their own column in myDF. Like before, show the number of rows and columns for the new myDF, as well as print the head.
Challenge: (0 pts, for fun) If you are looking for a challenge, try to do this in excel or without tidyverse.
Relevant topics: Negative Indexing, which
Item(s) to submit:
- R code used to solve the problem.
-
The number of rows and columns in
myDF. -
The
headofmyDF.
5. It seems like we've spent the majority of the project just wrangling our dataset -- that is normal! You'd be incredibly lucky to work in an environment where you recieve data in a nice, neat, perfect format. Let's do a couple basic operations now, to practice.
mutate is a powerful function in dplyr, that is not easy to mimic in Python's pandas package. mutate adds new columns to your tibble, while preserving your existing columns. It doesn't sound very powerful, but it is.
Use mutate to create a new column called generation. generation should contain "Gen Z" for ages [0, 24], "Millenial" for ages [25-40], "Gen X" for ages [41-56], and "Boomers II" for ages [57-66], and "Older" for all other ages.
Relevant topics: mutate, case_when, between
Item(s) to submit:
- R code used to solve the problem.
-
The number of rows and columns in
myDF. -
The
headofmyDF.
6. Use ggplot to create a scatterplot showing d_age on the x-axis, and lf_min_age on the y-axis. lf_min_age is the minimum age a user is okay dating. Color the points based on gender2. Add a proper title, and labels for the X and Y axes. Use alpha=.6.
Note: This may take quite a few minutes to create. Before creating a plot with the entire myDF, use myDF[1:10,]. If you are in a time crunch, the minimum number of points to plot to get full credit is 100, but if you wait, the plot is a bit more telling.
Relevant topics: ggplot
Item(s) to submit:
- R code used to solve the problem.
- Output from running your code.
- The plot produced.
Project 11
Motivation: Data wrangling is the process of gathering, cleaning, structuring, and transforming data. Data wrangling is a big part in any data driven project, and sometimes can take a great deal of time. 'tidyverse` is a great, but opinionated, suite of integrated packages to wrangle, tidy and visualize data. It is useful to gain some familiarity with this collection of packages, in case you run into a situation where these packages are needed -- you may even find that you enjoy using them!
Context: We have covered a few topics on the tidyverse packages, but there is a lot more to learn! We will continue our strong focus on the tidyverse (including ggplot) and data wrangling tasks.
Scope: R, tidyverse, ggplot
Learning objectives:
- Explain the differences between regular data frames and tibbles.
- Use mutate, pivot, unite, filter, and arrange to wrangle data and solve data-driven problems.
- Combine different data using joins (left_join, right_join, semi_join, anti_join), and bind_rows.
- Group data and calculate aggregated statistics using group_by, mutate, and transform functions.
-
Demonstrate the ability to create basic graphs with default settings, in
ggplot. - Demonstrate the ability to modify axes labels and titles.
Make sure to read about, and use the template found here, and the important information about projects submissions here.
The tidyverse consists of a variety of packages, including, but not limited to: ggplot2, dplyr, tidyr, readr, purrr, tibble, stringr, and lubridate.
One of the underlying premises of the tidyverse is getting the data to be tidy. You can read a lot more about this in Hadley Wickham's excellent book, R for Data Science.
There is an excellent graphic here that illustrates a general workflow for data science projects:
- Import
- Tidy
- Iterate on, to gain understanding:
- Transform
- Visualize
- Model
- Communicate
This is a good general outline of how a project could be organized, but depending on the project or company, this could vary greatly and change as the goals of a project change.
Dataset
The following questions will use the dataset found in Scholar:
/class/datamine/data/okcupid/filtered/*.csv
Questions
datamine_py()
library(tidyverse)

questions <- read_csv2("/class/datamine/data/okcupid/filtered/questions.csv")
users <- read_csv("/class/datamine/data/okcupid/filtered/users.csv")users$id <- 1:nrow(users)
set.seed(12345)
columns_to_pivot <- 1:2278
users_sample_long <- users[sample(nrow(users), 2200),] %>%
mutate_at(columns_to_pivot, as.character) %>%
pivot_longer(cols = columns_to_pivot, names_to="question", values_to = "selected_option")
myDF <- merge(users_sample_long, questions, by.x = "question", by.y = "X")users$id <- 1:nrow(users)
set.seed(12345)
columns_to_pivot <- 1:2278
users_sample_long <- users[sample(nrow(users), 2200),] %>%
mutate_at(columns_to_pivot, as.character) %>%
pivot_longer(cols = columns_to_pivot[-1242], names_to="question", values_to = "selected_option")
myDF <- merge(users_sample_long, questions, by.x = "question", by.y = "X")users$id <- 1:nrow(users)
set.seed(12345)
columns_to_pivot <- 1:2278
users_sample_long <- users[sample(nrow(users), 2200),] %>%
mutate_at(columns_to_pivot, as.character) %>%
pivot_longer(cols = columns_to_pivot[-(which(substr(names(users), 1, 1) != "q"))], names_to="question", values_to = "selected_option")
myDF <- merge(users_sample_long, questions, by.x = "question", by.y = "X")myDF <- myDF %>% mutate(generation=case_when(d_age<=24 ~ "Gen Z",
between(d_age, 25, 40) ~ "Millenial",
between(d_age, 41, 56) ~ "Gen X",
between(d_age, 57, 66) ~ "Boomers II",
TRUE ~ "Other"))ggplot(myDF[1:100,]) +
geom_point(aes(x=d_age, y = lf_min_age, col=gender2), alpha=.6) +
labs(title="Minimum dating age by gender", x="User age", y="Minimum date age")1. Let's pick up where we left in project 10. For those who struggled with project 10, I will post the solutions above either on Saturday morning, or at the latest Monday. Re-run your code from project 10 so we, once again, have our tibble, myDF.
At the end of project 10 we created a scatterplot showing d_age on the x-axis, and lf_min_age on the y-axis. In addition, we colored the points by gender2. In many cases, instead of just coloring the different dots, we may want to do the exact same plot for different groups. This can easily be accomplished using ggplot.
Without splitting or filtering your data prior to creating the plots, create a graphic with plots for each generation where we show d_age on the x-axis and lf_min_age on the y-axis, colored by gender2.
Important note: You do not need to modify myDF at all.
Important note: This may take quite a few minutes to create. Before creating a plot with the entire myDF, use myDF[1:50,]. If you are in a time crunch, the minimum number of points to plot to get full credit is 500, but if you wait, the plot is a bit more telling.
Relevant topics: facet_wrap, facet_grid
Item(s) to submit:
- R code used to solve the problem.
- Output from running your code.
- The plot produced.
2. By default, facet_wrap and facet_grid maintain the same scale for the x and y axes across the various plots. This makes it easier to compare visually. In this case, it may make it harder to see the patterns that emerge. Modify your code from question (1) to allow each facet to have its own x and y axis limits.
Hint: Look at the argument scales in the facet_wrap/facet_grid functions.
Relevant topics: facet_wrap, facet_grid
Item(s) to submit:
- R code used to solve the problem.
- Output from running your code.
- The plot produced.
3. Let's say we have a theory that the older generations tend to smoke more. You decided you want to create a plot that compares the percentage of smokers per generation. Before we do this, we need to wrangle the data a bit.
What are the possible values of d_smokes? Create a new column in myDF called is_smoker that has values TRUE, FALSE, or NA when applicable. You will need to determine how you will assign a user as a smoker or not -- this is up to you! Explain your cutoffs. Make sure you stay in the tidyverse to solve this problem.
Relevant topics: unique, mutate, case_when
Item(s) to submit:
- R code used to solve the problem.
- Output from running your code.
-
1-2 sentences explaining your logic and cutoffs for the new
is_smokercolumn. -
The
tableof theis_smokercolumn.
4. Great! Now that we have our new is_smoker column, create a new tibble called smokers_per_gen. smokers_per_gen should be a summary of myDF containing the percentage of smokers per generation.
Hint: The result, smokers_per_gen should have 2 columns: generation and percentage_of_smokers. It should have the same number of rows as there are generations.
Relevant topics: group_by, summarize
Item(s) to submit:
- R code used to solve the problem.
- Output from running your code.
5. Create a Cleveland dot plot using ggplot to show the percentage of smokers for the different generations. Use ggthemr to give your plot a new look! You can choose any theme you'd like!
Is our theory from question (3) correct? Explain why you think so, or not.
(OPTIONAL I, 0 points) To make the plot have a more aesthetic look, consider reordering the data by percentage of smokers, or even by the generation's age. You can do that before passing the data using the arrange function, or inside the geom_point function, using the reorder function. To re-order by generation, you can either use brute force, or you can create a new column called avg_age while using summarize. avg_age should be the average age for each group (using the variable d_age). You can use this new column, avg_age to re-order the data.
(OPTIONAL II, 0 points) Improve our plot, change the x-axis to be displayed as a percentage. You can use the scales package and the function scale_x_continuous to accomplish this.
Hint: Use geom_point not geom_dotplot to solve this problem.
Relevant topics: geom_point, ggthemr
Item(s) to submit:
- R code used to solve the problem.
- Output from running your code.
- The plot produced.
- 1-2 sentences commenting on the theory, and what are your conclusions based on your plot (if any).
6. Create an interesting visualization to answer a question you have regarding this dataset. Have fun playing with the different aesthetics. Make sure to modify your x-axis title, y-axis title, and title of your plot.
Item(s) to submit:
- R code used to solve the problem.
- Output from running your code.
- The plot produced.
- The question you are interested in answering.
- 1-2 sentences describing your plot, and the answer to your question.
Project 12
Motivation: As we mentioned before, data wrangling is a big part in any data driven project. "Data Scientists spend up to 80% of the time on data cleaning and 20 percent of their time on actual data analysis." Therefore, it is worth to spend some time mastering how to best tidy up our data.
Context: We are continuing to practice using various tidyverse packages, in order to wrangle data.
Scope: python
Learning objectives:
- Explain the differences between regular data frames and tibbles.
- Use mutate, pivot, unite, filter, and arrange to wrangle data and solve data-driven problems.
- Combine different data using joins (left_join, right_join, semi_join, anti_join), and bind_rows.
- Group data and calculate aggregated statistics using group_by, mutate, and transform functions.
-
Demonstrate the ability to create basic graphs with default settings, in
ggplot. - Demonstrate the ability to modify axes labels and titles.
Make sure to read about, and use the template found here, and the important information about projects submissions here.
The first step in any data science project is to define our problem statement. In this project, our goal is to gain insights into customers' behaviours with regards to online orders and restaurant ratings.
Dataset
The following questions will use the dataset found in Scholar:
/class/datamine/data/restaurant_recommendation/*.csv
Questions
1. Load the tidyverse suite a packages, and read the data from files orders.csv, train_customers.csv, and vendors.csv into tibbles named orders, customers, and vendors respectively.
Take a look the tibbles and describe in a few sentences the type of information contained in each dataset. Although the name can be self-explanatory, it is important to get an idea of what exactly we are looking at. For each combination of 2 datasets, which column would you use to join them?
Relevant topics: read_csv, str, glimpse, head
Item(s) to submit:
- R code used to solve the problem.
- Output from running your code.
-
1-2 sentences explaining each dataset (
orders,customers, andvendors). - 1-2 sentences for each combination of 2 datasets describing if we could combine the datasets or not, and which column you would you use to join them.
2. Let's tidy up our datasets a bit prior to joining them. For each dataset, complete the tasks below.
orders: remove all columns that haveNAfor every single row.customers: Take a look at the columndob. Based on its values, what do you believe was it supposed to contain? Can we rely on the numbers selected? Why or why not? Based on your answer, keep the columnsakeed_customer_id,gender, anddobor justakeed_customer_idandgender.vendors: Take a look at columnscountry_idandcity_id. Would they be useful to compare the vendors in our dataset? Why or why not? If not, remove the columns from the dataset.
Hint: There are a variety of ways to do this. To get a better feel for how powerful tidyverse can be, we recommend you try solving it using the select_if function without creating any additional functions.
Hint: Do not use drop_na function from dplyr. This drops rows not columns.
Relevant topics: select_if
Item(s) to submit:
- R code used to solve the problem.
- Output from running your code.
-
1-2 sentences describing what columns you kept for
vendorsandcustomersand why.
3. Use your solutions from questions (1) and (2), and the join functions from tidyverse (inner_join, left_join, right_join, and full_join) to create a single tibble called myDF containing information only where all 3 tibbles intersect.
For example, we do not want myDF to contain orders from customers that are not in customers tibble. Which function(s) from the tidyverse did you use to merge the datasets and why?
Hint: myDF should have 132,226 rows.
Hint: When combining two datasets, you may want to change the argument suffix in the join function to specify from which dataset it came from. For example, when joining customers and orders: *_join(customers, orders, suffix = c('_customers', '_orders')).
Relevant topics: inner_join, left_join, right_join, full_join
Item(s) to submit:
- R code used to solve the problem.
- Output from running your code.
- 1-2 sentences describing which function you used, and why.
4. Great, now we have a single, tidy dataset to work with. There are 2 vendor categories in myDF, Restaurants and Sweets & Bakes. We would expect there to be some differences. Let's compare them using the following variables: deliverydistance, item_count, grand_total, and vendor_discount_amount. Our end goal (by the end of question 5) is to create a histogram colored by the vendor's category (vendor_category_en), for each variable.
To accomplish this easily using ggplot, we will take advantage of pivot_longer. Pivot columns deliverydistance, item_count, grand_total, and vendor_discount_amount in myDF. The end result should be a tibble with columns variable and values, which contain the name of the pivoted column (variable), and values of those columns (values) Call this modified dataset myDF_long.
Relevant topics: pivot_longer
Item(s) to submit:
- R code used to solve the problem.
- Output from running your code.
5. Now that we have the data in the ideal format for our plot, create a histogram for each variable. Make sure to color them by vendor category (vendor_category_en). How do the two types of vendors compare in these 4 variables?
Hint: Use the argument fill instead of color in geom_histogram.
Hint: You may want to add some transparency to your plot. Add it using alpha argument in geom_histogram.
Hint: You may want to change the argument scales in facet_*.
Relevant topics: geom_histogram, facet_wrap, facet_grid
Item(s) to submit:
- R code used to solve the problem.
- Output from running your code.
-
2-3 sentences comparing
RestaurantsandSweets & Bakesfordeliverydistance,item_count,grand_totalandvendor_discount_amount.
Project 13
Motivation: Data wrangling tasks can vary between projects. Examples include joining multiple data sources, removing data that is irrelevant to the project, handling outliers, etc. Although we've practiced some of these skills, it is always worth it to spend some extra time to master tidying up our data.
Context: We will continue to gain familiarity with the tidyverse suite of packages (including ggplot), and data wrangling tasks.
Scope: r, tidyverse
Learning objectives:
- Explain the differences between regular data frames and tibbles.
- Use mutate, pivot, unite, filter, and arrange to wrangle data and solve data-driven problems.
- Combine different data using joins (left_join, right_join, semi_join, anti_join), and bind_rows.
- Group data and calculate aggregated statistics using group_by, mutate, and transmute functions.
- Demonstrate the ability to create basic graphs with default settings, in ggplot.
- Demonstrate the ability to modify axes labels and titles.
Make sure to read about, and use the template found here, and the important information about projects submissions here.
Dataset
The following questions will use the dataset found in Scholar:
/class/datamine/data/consumer_complaints/Consumer_Complaints.csv
Questions
1. Read the dataset into a tibble named complaintsDF. This dataset contains consumer complaints for over 5,000 companies. Our goal is to create a tibble called companyDF containing the following summary information for each company:
Company: The company name (Company)State: The state (State)percent_timely_response: Percentage of timely complaints (Timely response?)percent_consumer_disputed: Percentage of complaints that were disputed by the consumer (Consumer disputed?)percent_submitted_online: Percentage of complaints that were submitted online (use columnSubmitted via, and consider a submission to be an online submission if it was submitted viaWeborEmail)total_n_complaints: Total number of complaints
There are various ways to create companyDF. Let's practice using the pipes (%>%) to get companyDF. The idea is that our code at the end of question 2 will look something like this:
companyDF <- complaintsDF %>%
        insert_here_code_to_change_variables %>% # (question 1)
        insert_here_code_to_group_and_get_summaries_per_group  # (question 2)
First, create logical columns (columns containing TRUE or FALSE) for Timely response?, Consumer disputed? and Submitted via named timely_response_log, consumer_disputed_log and submitted_online, respectively.
timely_response_log and consumer_disputed_log will have value TRUE if Timely response? and Consumer disputed? have values Yes respectively, and FALSE if the value for the original column is No. submitted_online will have value TRUE if the the complaint was submitted via Web or Email.
You can double check your results for each column by getting a table with the original and modified column, as shown below. In this case, we would want all TRUE values to be in row Yes, and all FALSE to be in row No.
table(companyDF$`Timely response?`, companyDF$timely_response_log)Relevant topics: %>%, mutate, case_when
Item(s) to submit:
- R code used to solve the problem.
- Output from running your code.
2. Continue the pipeline we started in question (1). Get the summary information for each company. Note that you will need to include more pipes in the pseudo-code from question (1) as we want the summary for each company in each state. If a company is present in 4 states, companyDF should have 4 rows for that company -- one for each state. For the rest of the project, we will refer to a company as its unique combination of Company and State.
Hint: The function n() from dplyr counts the number of observations in the current group. It can only by used within mutate/transmute, filter, and the summarize functions.
Relevant topics: group_by, summarize, mean, n
Item(s) to submit:
- R code used to solve the problem.
- Output from running your code.
3. Using ggplot2, create a scatterplot showing the relationship between percent_timely_response and percent_consumer_disputed for companies with at least 500 complaints. Based on your results, do you believe there is an association between how timely the company's response is, and whether the consumer disputes? Why or why not?
Hint: Remember, here we consider each row of companyDF a unique company.
Relevant topics: filter, geom_point
Item(s) to submit:
- R code used to solve the problem.
- Output from running your code.
4. Which company, with at least 250 complaints, has the highest percent of consumer dispute?
Important note: We are learning tidyverse, so use tidyverse functions to solve this problem.
Relevant topics: filter, arrange
Item(s) to submit:
- R code used to solve the problem.
- Output from running your code.
5. Create a graph using ggplot2 that compares States based on any columns from companyDF or complaintsDF. You may need to summarize the data, filter, or even create new variables depending on what your metric of comparison is. Below are some examples of graphs that can be created. Do not feel limited by them. Make sure to change the labels for each axis, add a title, and change the theme.
- Cleveland's dotplot for the top 10 states with the highest ratio between percent of disputed complaints and timely response.
- Bar graph showing the total number of complaints in each state.
- Scatterplot comparing the percentage of timely responses in the state and average number of complaints per state.
- Line plot, where each line is a state, showing the total number of complaints per year.
Relevant topics:
Item(s) to submit:
- R code used to solve the problem.
- Output from running your code.
- The plot produced.
- 1-2 sentences commenting on your plot.
Project 14
Motivation: We covered a lot this year! When dealing with data driven projects, it is useful to explore the data, and answer different questions to get a feel for it. There are always different ways one can go about this. Proper preparation prevents poor performance, in this project we are going to practice using some of the skills you've learned, and review topics and languages in a generic way.
Context: We are on the last project where we will leave it up to you on how to solve the problems presented.
Scope: python, r, bash, unix, computers
Make sure to read about, and use the template found here, and the important information about projects submissions here.
Dataset
The following questions will use the dataset found in Scholar:
/class/datamine/data/disney/class/datamine/data/movies_and_tv/imdb.db/class/datamine/data/amazon/music.txt/class/datamine/data/craigslist/vehicles.csv/class/datamine/data/flights/2008.csv
Questions
Important: Answer the questions below using the language of your choice (R, Python, bash, awk, etc.). Don't feel limited by one language, you can use different languages to answer different questions. If you are feeling bold, you can also try answering the questions using all languages!
1. What percentage of flights in 2008 had a delay due to the weather? Use the /class/datamine/data/flights/2008.csv dataset to answer this question.
Hint: Consider a flight to have a weather delay if WEATHER_DELAY is greater than 0.
Item(s) to submit:
- The code used to solve the question.
- The answer to the question.
2. Which listed manufacturer has the most expensive previously owned car listed in Craiglist? Use the /class/datamine/data/craigslist/vehicles.csv dataset to answer this question. Only consider listings that have listed price less than $500,000 and where manufacturer information is available.
Item(s) to submit:
- The code used to solve the question.
- The answer to the question.
3. What is the most common and least common type of title in imdb ratings? Use the /class/datamine/data/movies_and_tv/imdb.db dataset to answer this question.
Hint: Use the titles table.
Hint: Don't know how to use SQL yet? To get this data into an R data.frame , for example:
library(tidyverse)

con <- DBI::dbConnect(RSQLite::SQLite(), ":memory:")
myDF <- tbl(con, "titles")
Item(s) to submit:
- The code used to solve the question.
- The answer to the question.
4. What percentage of music reviews contain the words hate or hated, and what percentage contain the words love or loved? Use the /class/datamine/data/amazon/music.txt dataset to answer this question.
Hint: It may take a minute to run, depending on the tool you use.
Item(s) to submit:
- The code used to solve the question.
- The answer to the question.
5. What is the best time to visit Disney? Use the data provided in /class/datamine/data/disney to answer the question.
First, you will need determine what you will consider "time", and the criteria you will use. See below some examples. Don't feel limited by them! Be sure to explain your criteria, use the data to investigate, and determine the best time to visit! Write 1-2 sentences commenting on your findings.
- As Splash Mountain is my favorite ride, my criteria is the smallest monthly average wait times for Splash Mountain between the years 2017 and 2019. I'm only considering these years as I expect them to be more representative. My definition of "best time" will be the "best months".
- Consider "best times" the days of the week that have the smallest wait time on average for all rides, or for certain favorite rides.
- Consider "best times" the season of the year where the park is open for longer hours.
- Consider "best times" the weeks of the year with smallest average high temperature in the day.
Item(s) to submit:
- The code used to solve the question.
- 1-2 sentences detailing the criteria you are going to use, its logic, and your defition for "best time".
- The answer to the question.
- 1-2 sentences commenting on your answer.
6. Finally, use RMarkdown (and its formatting) to outline 3 things you learned this semester from The Data Mine. For each thing you learned, give a mini demonstration where you highlight with text and code the thing you learned, and why you think it is useful. If you did not learn anything this semester from The Data Mine, write about 3 things you want to learn. Provide examples that demonstrate what you want to learn and write about why it would be useful.
Important: Make sure your answer to this question is formatted well and makes use of RMarkdown.
Item(s) to submit:
- 3 clearly labeled things you learned.
- 3 mini-demonstrations where you highlight with text and code the thin you learned, and why you think it is useful.
OR
- 3 clearly labeled things you want to learn.
- 3 examples demonstrating what you want to learn, with accompanying text explaining why you think it would be useful.